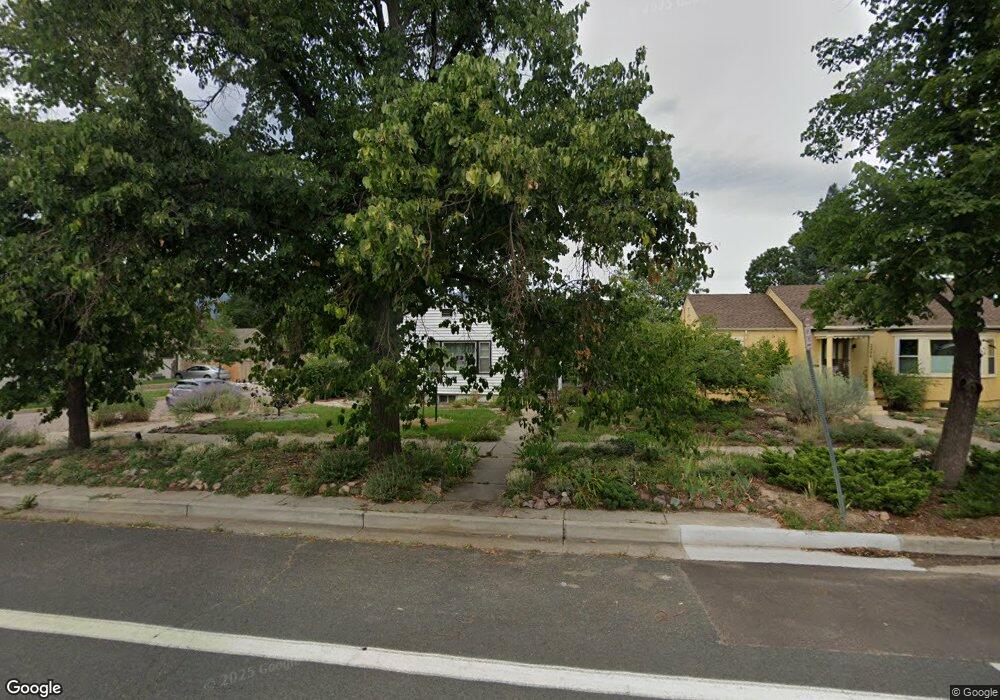
2302 N Cascade Ave Colorado Springs, CO 80907
Old North End NeighborhoodEstimated Value: $444,000 - $574,000
3
Beds
2
Baths
1,044
Sq Ft
$477/Sq Ft
Est. Value
About This Home
This home is located at 2302 N Cascade Ave, Colorado Springs, CO 80907 and is currently estimated at $497,628, approximately $476 per square foot. 2302 N Cascade Ave is a home located in El Paso County with nearby schools including Jackson Elementary School, North Middle School, and William J. Palmer High School.
Ownership History
Date
Name
Owned For
Owner Type
Purchase Details
Closed on
Dec 21, 2001
Sold by
Roscoe Michael G and Roscoe Laurel J
Bought by
Nagem Paul F and Nagem Atsumi
Current Estimated Value
Home Financials for this Owner
Home Financials are based on the most recent Mortgage that was taken out on this home.
Original Mortgage
$135,000
Outstanding Balance
$52,125
Interest Rate
6.41%
Estimated Equity
$445,503
Purchase Details
Closed on
May 29, 1998
Sold by
Cowern Rita M and Cowern Rita
Bought by
Roscoe Michael G and Roscoe Laurel J
Home Financials for this Owner
Home Financials are based on the most recent Mortgage that was taken out on this home.
Original Mortgage
$118,047
Interest Rate
7.22%
Mortgage Type
FHA
Purchase Details
Closed on
Sep 8, 1993
Bought by
Nagem Paul F
Purchase Details
Closed on
Sep 5, 1990
Bought by
Nagem Paul F
Purchase Details
Closed on
Aug 1, 1983
Bought by
Nagem Paul F
Create a Home Valuation Report for This Property
The Home Valuation Report is an in-depth analysis detailing your home's value as well as a comparison with similar homes in the area
Home Values in the Area
Average Home Value in this Area
Purchase History
| Date | Buyer | Sale Price | Title Company |
|---|---|---|---|
| Nagem Paul F | $180,000 | First American | |
| Roscoe Michael G | $121,000 | Land Title | |
| Nagem Paul F | $83,000 | -- | |
| Nagem Paul F | $68,500 | -- | |
| Nagem Paul F | -- | -- |
Source: Public Records
Mortgage History
| Date | Status | Borrower | Loan Amount |
|---|---|---|---|
| Open | Nagem Paul F | $135,000 | |
| Previous Owner | Roscoe Michael G | $118,047 |
Source: Public Records
Tax History Compared to Growth
Tax History
| Year | Tax Paid | Tax Assessment Tax Assessment Total Assessment is a certain percentage of the fair market value that is determined by local assessors to be the total taxable value of land and additions on the property. | Land | Improvement |
|---|---|---|---|---|
| 2025 | $1,564 | $29,180 | -- | -- |
| 2024 | $1,448 | $32,570 | $7,240 | $25,330 |
| 2022 | $1,464 | $26,160 | $6,000 | $20,160 |
| 2021 | $1,588 | $26,920 | $6,180 | $20,740 |
| 2020 | $1,580 | $23,280 | $4,940 | $18,340 |
| 2019 | $1,572 | $23,280 | $4,940 | $18,340 |
| 2018 | $1,491 | $20,320 | $4,490 | $15,830 |
| 2017 | $1,412 | $20,320 | $4,490 | $15,830 |
| 2016 | $1,084 | $18,690 | $4,620 | $14,070 |
| 2015 | $1,079 | $18,690 | $4,620 | $14,070 |
| 2014 | $1,041 | $17,300 | $4,620 | $12,680 |
Source: Public Records
Map
Nearby Homes
- 2118 N Tejon St
- 2112 N Tejon St
- 2327 N Nevada Ave
- 2030 N Nevada Ave
- 4 W Harrison St
- 2511 Tremont St
- 2432 N Weber St
- 228 E Jefferson St
- 317 W Harrison St
- 417 W Harrison St
- 215 E Washington St
- 2409 N Wahsatch Ave
- 119 E Fontanero St
- 21 W Polk St
- 410 E Jefferson St
- 513 & 515 W Tyler St
- 2815 Beacon St
- 1730 N Nevada Ave
- 2821 Beacon St
- 1905 N Wahsatch Ave
- 2306 N Cascade Ave
- 2312 N Cascade Ave
- 12 W Monroe St
- 12 W Monroe St Unit Studio over the Gara
- 2314 N Cascade Ave
- 9 W Monroe St
- 2228 N Cascade Ave
- 15 W Monroe St
- 20 W Monroe St
- 2220 N Cascade Ave
- 2227 Wood Ave
- 2303 Wood Ave
- 2218 N Cascade Ave
- 2313 Wood Ave
- 2216 N Cascade Ave
- 2231 Wood Ave
- 2221 Wood Ave
- 2212 N Cascade Ave
- 2215 Wood Ave
- 2211 Wood Ave