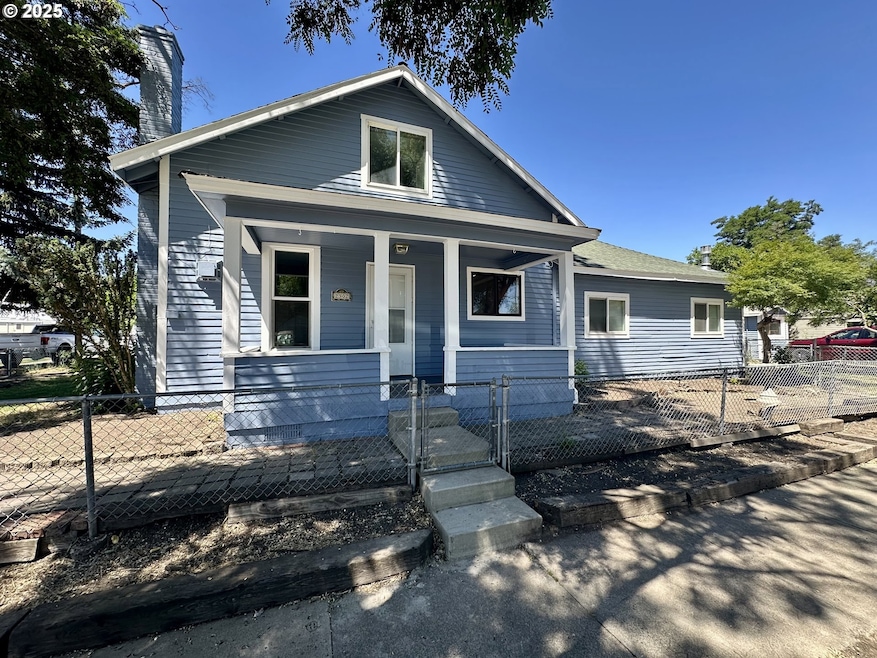

$299,000
- 4 Beds
- 2 Baths
- 2,401 Sq Ft
- 1705 Z Ave
- La Grande, OR
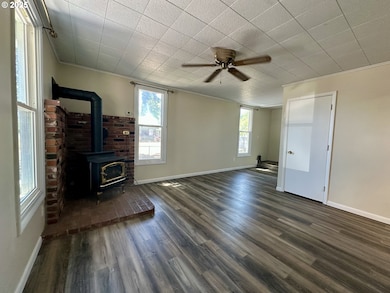
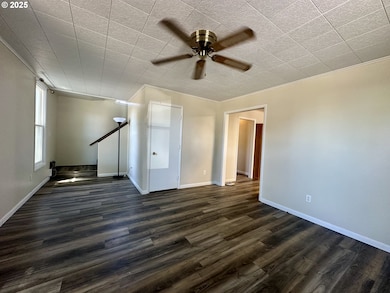
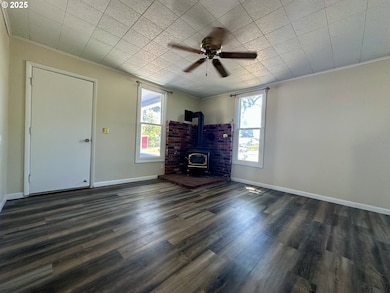
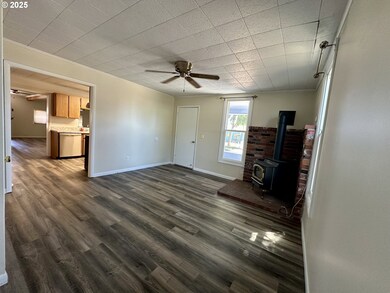
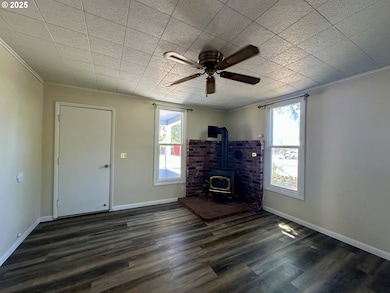
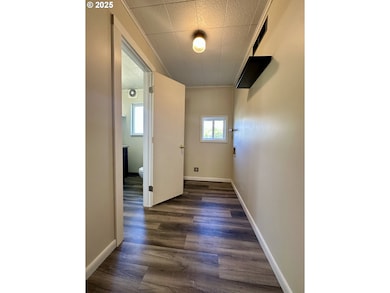
Welcome to this well-maintained four-bedroom, two-bathroom home situated on a generous 0.37-acre lot, offering space, functionality, and flexibility both inside and out! Enjoy updated flooring throughout the main living areas, a comfortable layout, spacious laundry room and a private primary suite complete with a full bathroom. The large, unfinished basement provides endless potential for
Lana Anderson High Country Realty Professionals