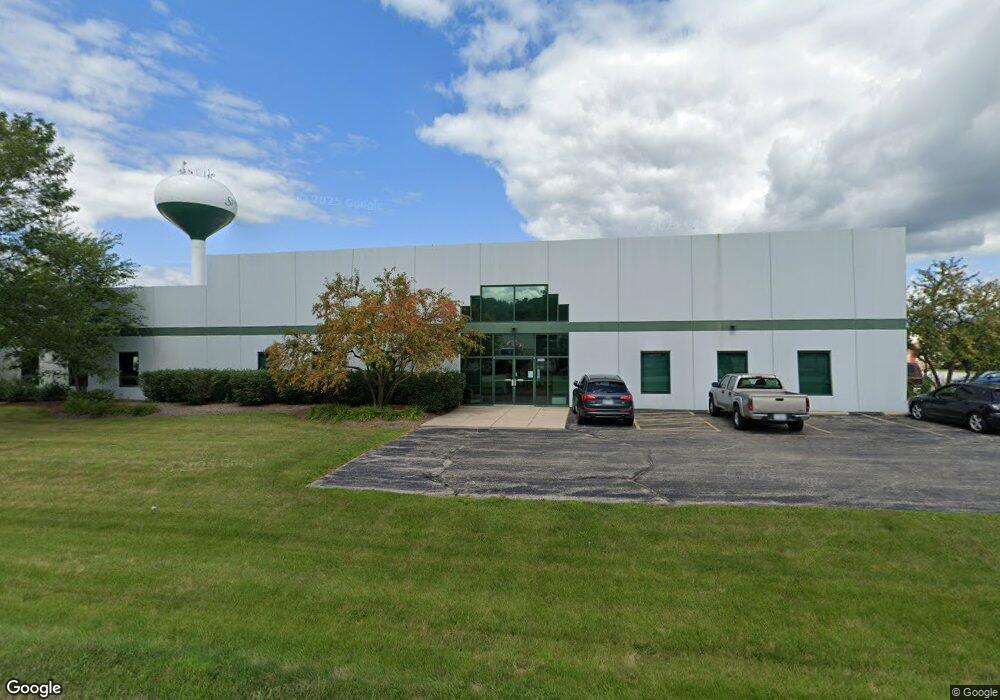
2302 Spring Ridge Dr Spring Grove, IL 60081
Estimated Value: $2,339,508
Studio
--
Bath
28,550
Sq Ft
$82/Sq Ft
Est. Value
About This Home
This home is located at 2302 Spring Ridge Dr, Spring Grove, IL 60081 and is currently estimated at $2,339,508, approximately $81 per square foot. 2302 Spring Ridge Dr is a home located in McHenry County with nearby schools including Spring Grove Elementary School, Nippersink Middle School, and Richmond-Burton High School.
Ownership History
Date
Name
Owned For
Owner Type
Purchase Details
Closed on
Jan 7, 2025
Sold by
Trust Number 122543 and Chicago Title Land Trust Company
Bought by
S Grove Property Llc
Current Estimated Value
Home Financials for this Owner
Home Financials are based on the most recent Mortgage that was taken out on this home.
Original Mortgage
$940,000
Outstanding Balance
$932,302
Interest Rate
8.1%
Estimated Equity
$1,407,206
Purchase Details
Closed on
Sep 15, 1999
Sold by
First Midwest Trust Company Natl Assn
Bought by
Lasalle Bank National Assn and Trust #122543
Home Financials for this Owner
Home Financials are based on the most recent Mortgage that was taken out on this home.
Original Mortgage
$1,000,000
Interest Rate
8.64%
Mortgage Type
Credit Line Revolving
Purchase Details
Closed on
Feb 23, 1995
Sold by
Home State Bank National Assn
Bought by
Weidner Ronald and Schiller Mark
Create a Home Valuation Report for This Property
The Home Valuation Report is an in-depth analysis detailing your home's value as well as a comparison with similar homes in the area
Home Values in the Area
Average Home Value in this Area
Purchase History
| Date | Buyer | Sale Price | Title Company |
|---|---|---|---|
| S Grove Property Llc | $2,150,000 | Chicago Title | |
| Lasalle Bank National Assn | $1,120,500 | First American | |
| Weidner Ronald | -- | Midamerica Title |
Source: Public Records
Mortgage History
| Date | Status | Borrower | Loan Amount |
|---|---|---|---|
| Open | S Grove Property Llc | $940,000 | |
| Closed | S Grove Property Llc | $1,175,000 | |
| Previous Owner | Lasalle Bank National Assn | $1,000,000 |
Source: Public Records
Tax History
| Year | Tax Paid | Tax Assessment Tax Assessment Total Assessment is a certain percentage of the fair market value that is determined by local assessors to be the total taxable value of land and additions on the property. | Land | Improvement |
|---|---|---|---|---|
| 2024 | $30,275 | $395,853 | $53,752 | $342,101 |
| 2023 | $29,595 | $361,873 | $49,138 | $312,735 |
| 2022 | $28,222 | $325,836 | $44,245 | $281,591 |
| 2021 | $20,161 | $215,149 | $42,466 | $172,683 |
| 2020 | $21,075 | $207,013 | $40,860 | $166,153 |
| 2019 | $21,369 | $232,485 | $39,547 | $192,938 |
| 2018 | $29,017 | $281,952 | $37,913 | $244,039 |
| 2017 | $37,684 | $330,264 | $36,104 | $294,160 |
| 2016 | $33,392 | $309,642 | $33,850 | $275,792 |
| 2013 | -- | $317,984 | $32,005 | $285,979 |
Source: Public Records
Map
Nearby Homes
- 2003 Red Oak Ln
- 1992 Red Oak Ln
- 7377 English Oak Ln
- 7381 English Oak Ln
- 7373 English Oak Ln
- 7393 English Oak Ln
- 7389 English Oak Ln
- Lot 36 Red Oak Ln
- 1876 Red Oak Ln
- 2150 U S 12
- 7388 English Oak Ln
- LOT 9 Mayo Ct
- 1979 Red Oak Ln
- 2617 Spring Leaf Dr
- 1975 Red Oak Ln
- 1971 Red Oak Ln
- 1852 Red Oak Ln
- 1848 Red Oak Ln
- 1715 Cedar Ln
- 7416 Briar Ct
- 2304 Spring Ridge Dr
- 2304 Spring Ridge Dr Unit E-F
- 2304 Spring Ridge Dr Unit D
- 2221 Pierce Dr
- 2402 Spring Ridge Dr Unit I
- 2222 Pierce Dr Unit B
- 2401 N Us Highway 12
- 2401 N Us Highway 12
- 2404 Spring Ridge Dr Unit H
- 2404 Spring Ridge Dr Unit I
- 2404 Spring Ridge Dr Unit G
- 2404 Spring Ridge Dr
- 7501 Meyer Rd Unit B
- 7501 Meyer Rd Unit OFFICE
- 7501 Meyer Rd Unit B
- 7501 Meyer Rd
- 2314 N Us Highway 12
- 2306 U S Route 12 Unit A2-1
- 2306 N Us Highway 12 Unit A1-4
- 2306 U S Route 12 Unit A1-2
Your Personal Tour Guide
Ask me questions while you tour the home.