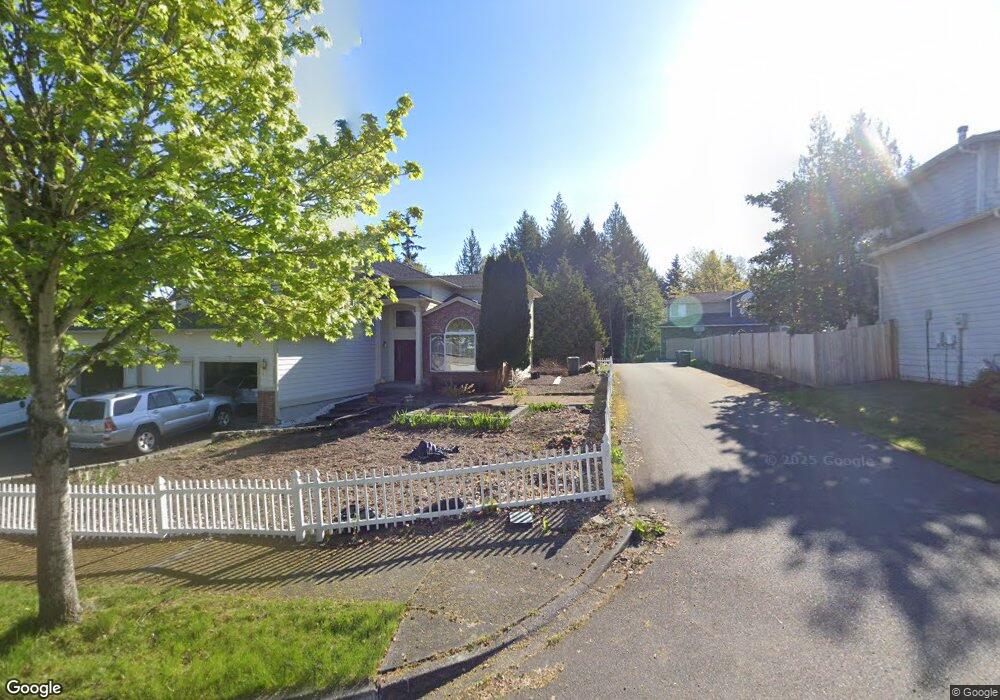
23021 21st Ave SE Bothell, WA 98021
Canyon Park NeighborhoodEstimated Value: $1,059,000 - $1,315,000
3
Beds
3
Baths
2,140
Sq Ft
$575/Sq Ft
Est. Value
About This Home
This home is located at 23021 21st Ave SE, Bothell, WA 98021 and is currently estimated at $1,229,588, approximately $574 per square foot. 23021 21st Ave SE is a home located in Snohomish County with nearby schools including Maywood Hills Elementary School, Canyon Park Junior High School, and Bothell High School.
Ownership History
Date
Name
Owned For
Owner Type
Purchase Details
Closed on
Oct 21, 2024
Sold by
Copeland Jason M and Copeland Jason Michael
Bought by
Siddiqui Mohd Faraz and Qutbi Madiha
Current Estimated Value
Home Financials for this Owner
Home Financials are based on the most recent Mortgage that was taken out on this home.
Original Mortgage
$959,995
Outstanding Balance
$945,118
Interest Rate
6.35%
Mortgage Type
New Conventional
Estimated Equity
$284,470
Purchase Details
Closed on
Sep 22, 2022
Sold by
Copeland Bluesette
Bought by
Copeland Jason M
Home Financials for this Owner
Home Financials are based on the most recent Mortgage that was taken out on this home.
Original Mortgage
$260,000
Interest Rate
6.92%
Mortgage Type
New Conventional
Purchase Details
Closed on
Oct 13, 2002
Sold by
Puget Homes Corp
Bought by
Copeland Jason and Hoit Bluesette
Home Financials for this Owner
Home Financials are based on the most recent Mortgage that was taken out on this home.
Original Mortgage
$257,600
Interest Rate
6.09%
Create a Home Valuation Report for This Property
The Home Valuation Report is an in-depth analysis detailing your home's value as well as a comparison with similar homes in the area
Home Values in the Area
Average Home Value in this Area
Purchase History
We collect this data history from publicly available records. To have your information removed, we recommend requesting removal directly through your county’s website.
| Date | Buyer | Sale Price | Title Company |
|---|---|---|---|
| Siddiqui Mohd Faraz | $1,199,996 | Wfg National Title | |
| Copeland Jason M | -- | -- | |
| Copeland Jason | $322,000 | Chicago Title Insurance Co |
Source: Public Records
Mortgage History
We collect this data history from publicly available records. To have your information removed, we recommend requesting removal directly through your county’s website.
| Date | Status | Borrower | Loan Amount |
|---|---|---|---|
| Open | Siddiqui Mohd Faraz | $959,995 | |
| Previous Owner | Copeland Jason M | $260,000 | |
| Previous Owner | Copeland Jason | $257,600 | |
| Closed | Copeland Jason | $48,300 |
Source: Public Records
Tax History
| Year | Tax Paid | Tax Assessment Tax Assessment Total Assessment is a certain percentage of the fair market value that is determined by local assessors to be the total taxable value of land and additions on the property. | Land | Improvement |
|---|---|---|---|---|
| 2026 | $8,960 | $1,255,900 | $805,300 | $450,600 |
| 2025 | $8,158 | $1,075,000 | $686,500 | $388,500 |
| 2024 | $8,158 | $974,500 | $599,900 | $374,600 |
| 2023 | $8,320 | $1,086,000 | $659,100 | $426,900 |
| 2022 | $7,345 | $772,900 | $410,300 | $362,600 |
| 2020 | $7,114 | $695,300 | $382,500 | $312,800 |
| 2019 | $6,130 | $620,200 | $310,500 | $309,700 |
| 2018 | $5,651 | $550,700 | $270,000 | $280,700 |
| 2017 | $4,942 | $487,300 | $225,000 | $262,300 |
| 2016 | $4,411 | $448,900 | $198,000 | $250,900 |
| 2015 | $4,441 | $428,700 | $184,500 | $244,200 |
| 2013 | $4,054 | $344,300 | $148,500 | $195,800 |
Source: Public Records
Map
Nearby Homes
- 1923 233rd Place SE
- 23502 25th Dr SE
- 23210 27th Ave SE Unit 1
- 23623 23rd Ave SE
- 23115 15th Ave SE Unit D1
- 3515 237th St SE Unit 28
- 23031 27th Dr SE Unit 59
- 22414 18th Ave SE
- 23825 15th Ave SE Unit 427
- 23825 15th Ave SE Unit 93
- 23825 15th Ave SE Unit 311
- 23825 15th Ave SE Unit 151
- 23825 15th Ave SE Unit 159
- 23825 23rd Dr SE
- 24319 13 Ave SE Unit CR21
- 24330 13 Ave SE Unit CR13
- 24318 13 Ave SE Unit 10
- 24322 13 Ave SE Unit 11
- 23510 14th Dr SE
- 1 XXX 240th St SE
- 23021 21st Ave SE
- 23009 21st Ave SE
- 23103 21st Ave SE
- 23017 21st Ave SE
- 23009 21st Ave SE
- 23107 21st Ave SE
- 23013 21st Ave SE
- 23005 21st Ave SE
- 23119 21st Ave SE
- 23111 21st Ave SE
- 2221 232nd St SE
- 23020 21st Ave SE
- 23108 21st Ave SE
- 23012 21st Ave SE
- 23127 21st Ave SE
- 23127 21st Ave SE
- 23116 21st Ave SE
- 22929 21st Ave SE
- 23109 20th Ave SE
- 23117 20th Ave SE
Your Personal Tour Guide
Ask me questions while you tour the home.