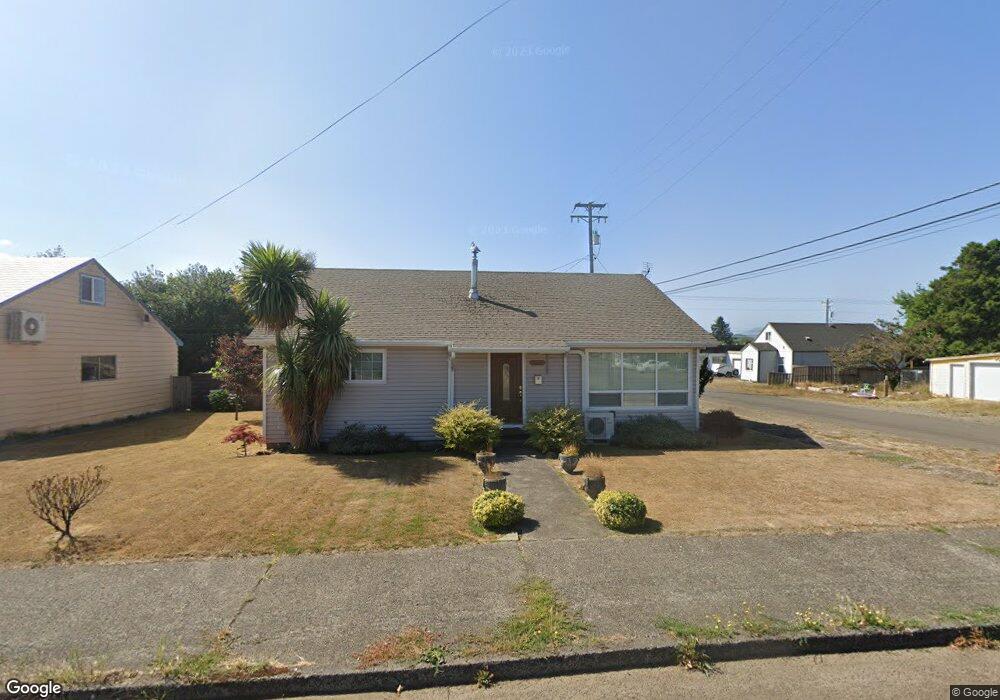
2303 10th St Tillamook, OR 97141
Estimated Value: $312,000 - $362,231
2
Beds
2
Baths
1,780
Sq Ft
$190/Sq Ft
Est. Value
About This Home
This home is located at 2303 10th St, Tillamook, OR 97141 and is currently estimated at $337,808, approximately $189 per square foot. 2303 10th St is a home located in Tillamook County with nearby schools including Tillamook High School, Little Clipper Preschool, and Tillamook Adventist School.
Ownership History
Date
Name
Owned For
Owner Type
Purchase Details
Closed on
Sep 11, 2018
Sold by
Rockaway Beach Resort Inc
Bought by
Hinkle Nathan and Hinkle Bernice
Current Estimated Value
Purchase Details
Closed on
Feb 19, 2013
Sold by
Johnson Janetta L and Walker Janetta L
Bought by
Horner Deanne M
Purchase Details
Closed on
Apr 9, 2009
Sold by
Citibank Na
Bought by
Walker Janetta L
Home Financials for this Owner
Home Financials are based on the most recent Mortgage that was taken out on this home.
Original Mortgage
$161,938
Interest Rate
5.17%
Mortgage Type
Purchase Money Mortgage
Purchase Details
Closed on
Dec 12, 2008
Sold by
Christiansen Christina M and Bush Christina M
Bought by
Citibank Na
Purchase Details
Closed on
Oct 1, 2008
Sold by
Bush Corey J
Bought by
Bush Christina M
Create a Home Valuation Report for This Property
The Home Valuation Report is an in-depth analysis detailing your home's value as well as a comparison with similar homes in the area
Home Values in the Area
Average Home Value in this Area
Purchase History
| Date | Buyer | Sale Price | Title Company |
|---|---|---|---|
| Hinkle Nathan | -- | None Available | |
| Horner Deanne M | $169,000 | First American | |
| Walker Janetta L | $158,700 | Fidelity Natl Title Co Of Or | |
| Citibank Na | $159,325 | Fidelity Natl Title Co Of Or | |
| Bush Christina M | -- | First American Title |
Source: Public Records
Mortgage History
| Date | Status | Borrower | Loan Amount |
|---|---|---|---|
| Previous Owner | Walker Janetta L | $161,938 |
Source: Public Records
Tax History Compared to Growth
Tax History
| Year | Tax Paid | Tax Assessment Tax Assessment Total Assessment is a certain percentage of the fair market value that is determined by local assessors to be the total taxable value of land and additions on the property. | Land | Improvement |
|---|---|---|---|---|
| 2024 | $2,219 | $188,370 | $51,350 | $137,020 |
| 2023 | $2,198 | $182,890 | $49,850 | $133,040 |
| 2022 | $2,123 | $177,570 | $48,400 | $129,170 |
| 2021 | $2,060 | $172,400 | $46,990 | $125,410 |
| 2020 | $2,003 | $167,380 | $45,620 | $121,760 |
| 2019 | $1,953 | $162,510 | $44,290 | $118,220 |
| 2018 | $1,902 | $157,780 | $43,000 | $114,780 |
| 2017 | $1,854 | $153,190 | $41,750 | $111,440 |
| 2016 | $1,785 | $148,730 | $40,530 | $108,200 |
| 2015 | $1,748 | $144,400 | $39,350 | $105,050 |
| 2014 | $1,719 | $140,200 | $38,200 | $102,000 |
| 2013 | -- | $136,120 | $37,090 | $99,030 |
Source: Public Records
Map
Nearby Homes
- 2105 9th St
- 2417 10th St
- 02600 12th St
- 1010 Ivy Ave
- 616 Park Ave
- 1806 8th St
- 1006 Stillwell Ave
- 1009 Grove Ave
- 1003 Grove Ave
- 1009/1011 Grove Ave Unit 1009-11
- 00101 Wilson River Hwy
- 00201 Wilson River Hwy
- TL #00101 Wilson River Hwy
- TL# 02100 Wilson River Hwy
- Parcel 1 Wilson River Hwy
- Parcel 2 Wilson River Hwy
- 500 etc. Wilson River Hwy
- 2410 3rd St
- 1706 5th St
- 1703 4th St
- 2307 10th St
- 1015 Madrona Ave
- 2306 11th St
- 1002 Nestucca Ave
- 2215 10th St
- 1012 Madrona Ave
- 1012 Nestucca Ave
- 1014 Madrona Ave
- 909 Madrona Ave Unit A
- 909 Madrona Ave
- 910 Madrona Ave
- 914 Nestucca Ave
- 2207 10th St
- 2208 10th St
- 1011 Laurel Ave
- 2204 10th St
- 903 Madrona Ave
- 2305 9th St
- 2203 10th St
- 2213 10th St