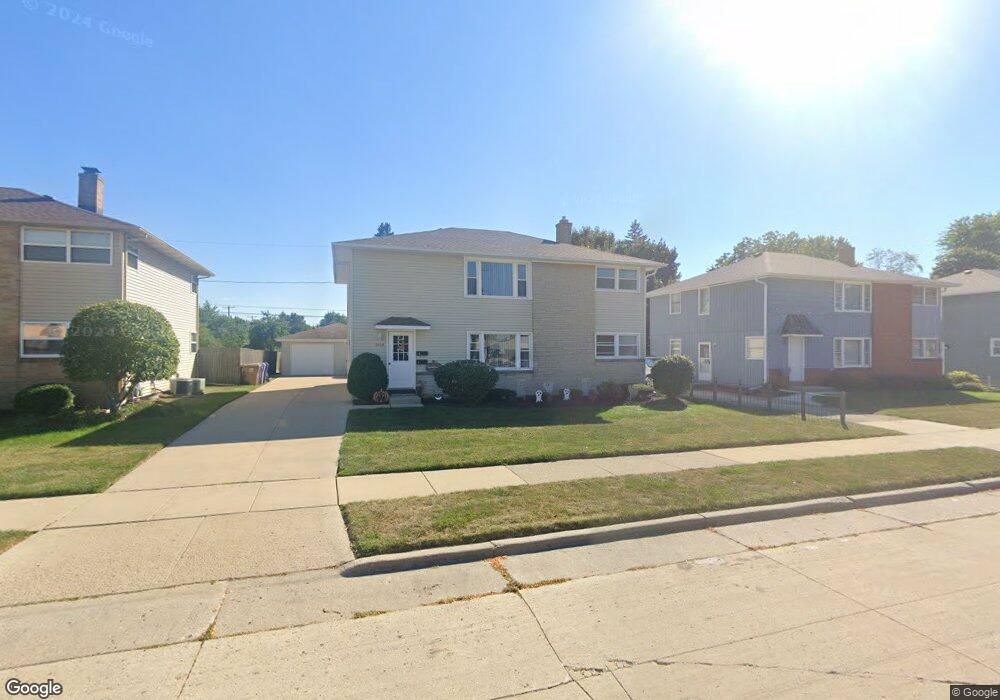
2303 81st St Kenosha, WI 53143
Sunnyside NeighborhoodEstimated Value: $274,000 - $312,000
6
Beds
2
Baths
2,242
Sq Ft
$132/Sq Ft
Est. Value
About This Home
This home is located at 2303 81st St, Kenosha, WI 53143 and is currently estimated at $297,001, approximately $132 per square foot. 2303 81st St is a home located in Kenosha County with nearby schools including Vernon Elementary School, Lance Middle School, and Tremper High School.
Ownership History
Date
Name
Owned For
Owner Type
Purchase Details
Closed on
Feb 6, 2015
Sold by
Citizens Bank Of Mukwonago
Bought by
Jugar Llc
Current Estimated Value
Home Financials for this Owner
Home Financials are based on the most recent Mortgage that was taken out on this home.
Original Mortgage
$200,000
Outstanding Balance
$152,958
Interest Rate
3.72%
Mortgage Type
Future Advance Clause Open End Mortgage
Estimated Equity
$144,043
Purchase Details
Closed on
Jun 4, 2013
Sold by
Hervat Brian W
Bought by
Citizens Bank Of Mukwonago
Purchase Details
Closed on
Aug 7, 2009
Sold by
Hervat Michelle L
Bought by
Hervat Brian W
Purchase Details
Closed on
Nov 1, 2006
Sold by
Zieth Ronald J
Bought by
Hervat Brian W and Hervat Michelle L
Home Financials for this Owner
Home Financials are based on the most recent Mortgage that was taken out on this home.
Original Mortgage
$162,317
Interest Rate
6.45%
Mortgage Type
Credit Line Revolving
Create a Home Valuation Report for This Property
The Home Valuation Report is an in-depth analysis detailing your home's value as well as a comparison with similar homes in the area
Home Values in the Area
Average Home Value in this Area
Purchase History
| Date | Buyer | Sale Price | Title Company |
|---|---|---|---|
| Jugar Llc | $350,000 | -- | |
| Citizens Bank Of Mukwonago | $689,800 | -- | |
| Hervat Brian W | $213,200 | -- | |
| Hervat Brian W | $162,000 | None Available |
Source: Public Records
Mortgage History
| Date | Status | Borrower | Loan Amount |
|---|---|---|---|
| Open | Jugar Llc | $200,000 | |
| Previous Owner | Hervat Brian W | $162,317 |
Source: Public Records
Tax History Compared to Growth
Tax History
| Year | Tax Paid | Tax Assessment Tax Assessment Total Assessment is a certain percentage of the fair market value that is determined by local assessors to be the total taxable value of land and additions on the property. | Land | Improvement |
|---|---|---|---|---|
| 2024 | $3,589 | $146,400 | $36,700 | $109,700 |
| 2023 | $3,589 | $146,400 | $36,700 | $109,700 |
| 2022 | $3,623 | $146,400 | $36,700 | $109,700 |
| 2021 | $3,747 | $146,400 | $36,700 | $109,700 |
| 2020 | $3,817 | $146,400 | $36,700 | $109,700 |
| 2019 | $3,688 | $146,400 | $36,700 | $109,700 |
| 2018 | $3,622 | $124,900 | $36,700 | $88,200 |
| 2017 | $3,378 | $124,900 | $36,700 | $88,200 |
| 2016 | $3,310 | $124,900 | $36,700 | $88,200 |
| 2015 | $3,429 | $124,700 | $36,700 | $88,000 |
| 2014 | $3,638 | $124,700 | $36,700 | $88,000 |
Source: Public Records
Map
Nearby Homes