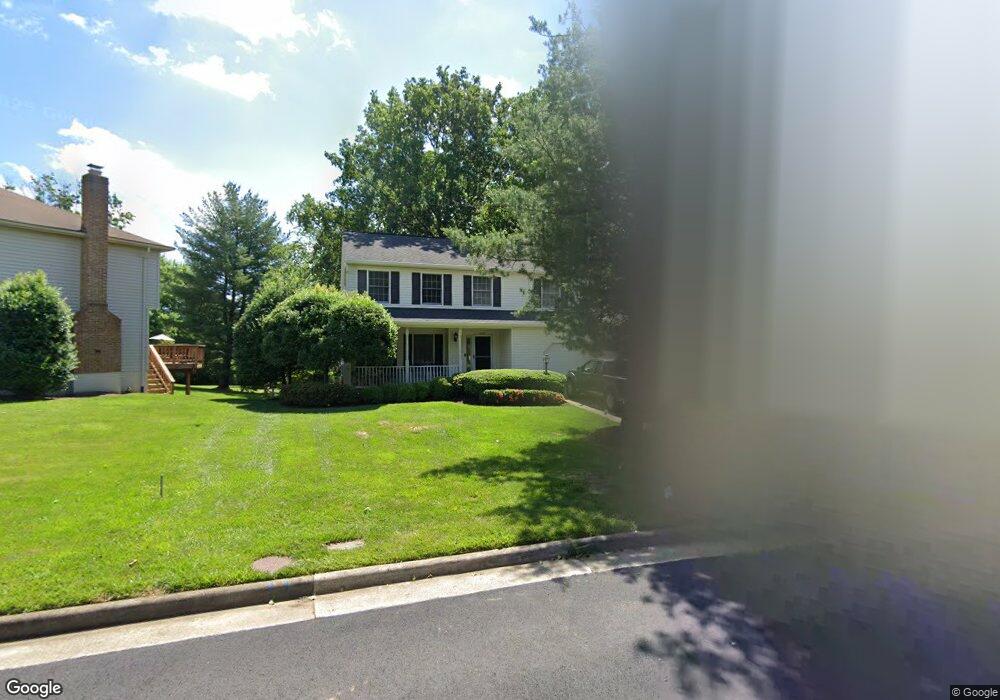
2303 Cavesson Ct Reston, VA 20191
Estimated Value: $728,000 - $854,850
4
Beds
4
Baths
1,876
Sq Ft
$432/Sq Ft
Est. Value
About This Home
This home is located at 2303 Cavesson Ct, Reston, VA 20191 and is currently estimated at $811,213, approximately $432 per square foot. 2303 Cavesson Ct is a home located in Fairfax County with nearby schools including Dogwood Elementary, Langston Hughes Middle School, and South Lakes High School.
Ownership History
Date
Name
Owned For
Owner Type
Purchase Details
Closed on
Jun 30, 2005
Sold by
Murphy Gerald M
Bought by
Basnight Fentress B
Current Estimated Value
Home Financials for this Owner
Home Financials are based on the most recent Mortgage that was taken out on this home.
Original Mortgage
$450,000
Outstanding Balance
$235,967
Interest Rate
5.73%
Mortgage Type
New Conventional
Estimated Equity
$575,246
Purchase Details
Closed on
Feb 21, 2002
Sold by
Dennis Randall
Bought by
Murphy Gerald
Home Financials for this Owner
Home Financials are based on the most recent Mortgage that was taken out on this home.
Original Mortgage
$202,400
Interest Rate
7.08%
Mortgage Type
New Conventional
Purchase Details
Closed on
May 31, 1996
Sold by
Associates Relocaton Mgmt Co
Bought by
Dennis Randall L
Home Financials for this Owner
Home Financials are based on the most recent Mortgage that was taken out on this home.
Original Mortgage
$156,800
Interest Rate
7.91%
Create a Home Valuation Report for This Property
The Home Valuation Report is an in-depth analysis detailing your home's value as well as a comparison with similar homes in the area
Home Values in the Area
Average Home Value in this Area
Purchase History
| Date | Buyer | Sale Price | Title Company |
|---|---|---|---|
| Basnight Fentress B | $585,000 | -- | |
| Murphy Gerald | $253,000 | -- | |
| Dennis Randall L | $196,000 | -- | |
| Associates Relocation Mgmt Co | $190,500 | -- |
Source: Public Records
Mortgage History
| Date | Status | Borrower | Loan Amount |
|---|---|---|---|
| Open | Basnight Fentress B | $450,000 | |
| Previous Owner | Murphy Gerald | $202,400 | |
| Previous Owner | Associates Relocation Mgmt Co | $156,800 |
Source: Public Records
Tax History
| Year | Tax Paid | Tax Assessment Tax Assessment Total Assessment is a certain percentage of the fair market value that is determined by local assessors to be the total taxable value of land and additions on the property. | Land | Improvement |
|---|---|---|---|---|
| 2025 | $8,072 | $742,210 | $326,000 | $416,210 |
| 2024 | $8,072 | $669,610 | $298,000 | $371,610 |
| 2023 | $7,652 | $650,970 | $298,000 | $352,970 |
| 2022 | $7,285 | $611,950 | $274,000 | $337,950 |
| 2021 | $7,067 | $579,060 | $250,000 | $329,060 |
| 2020 | $6,850 | $556,720 | $236,000 | $320,720 |
| 2019 | $6,989 | $568,020 | $236,000 | $332,020 |
| 2018 | $6,184 | $537,700 | $212,000 | $325,700 |
| 2017 | $6,312 | $522,500 | $203,000 | $319,500 |
| 2016 | $6,170 | $511,860 | $203,000 | $308,860 |
| 2015 | $5,953 | $511,860 | $203,000 | $308,860 |
| 2014 | $5,720 | $492,860 | $193,000 | $299,860 |
Source: Public Records
Map
Nearby Homes
- 12701 Roark Ct
- 12742 Verdant Way
- 12302 Scotch Bonnet Ct
- 2405 Tatnuck Ct
- 12913 Centre Park Cir Unit 102
- 2460 Leyland Ridge Rd
- 12917 Centre Park Cir Unit 217
- 12917 Centre Park Cir Unit 315
- 12517 Fox View Way
- 12909 Centre Park Cir Unit 102
- 12933 Centre Park Cir Unit 406
- 12905 Centre Park Cir Unit 212
- 12957 Centre Park Cir Unit 103
- 12953 Centre Park Cir Unit 417
- 2448 Leyland Ridge Rd
- 12956 Centre Park Cir Unit 110
- 12958 Centre Park Cir Unit 120
- 12875 Mosaic Park Way Unit 4-X
- 12154 Captiva Ct
- 55 Silverway Dr Unit 48
- 12613 Bridoon Ln
- 2305 Cavesson Ct
- 12611 Bridoon Ln
- 2307 Cavesson Ct
- 12615 Bridoon Ln
- 12609 Bridoon Ln
- 2304 Cavesson Ct
- 12612 Bridoon Ln
- 2309 Cavesson Ct
- 12616 Bridoon Ln
- 12617 Bridoon Ln
- 12607 Bridoon Ln
- 2308 Cavesson Ct
- 12608 Bridoon Ln
- 2306 Cavesson Ct
- 2314 Archdale Rd
- 2312 Archdale Rd
- 12620 Bridoon Ln
- 2316 Archdale Rd
- 12619 Bridoon Ln
Your Personal Tour Guide
Ask me questions while you tour the home.