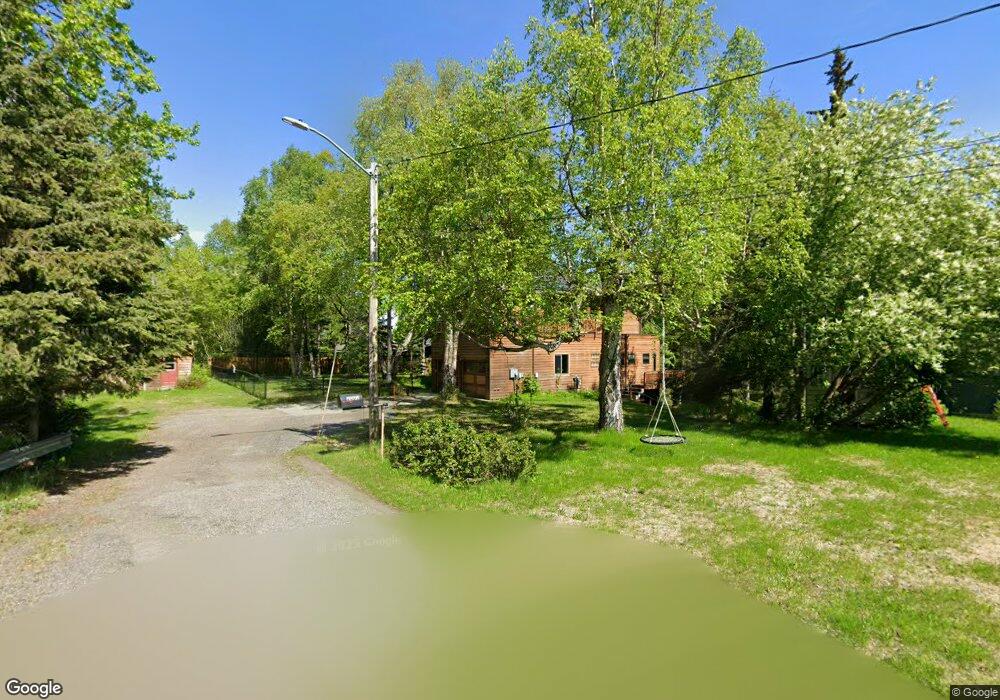
2303 Chilligan Dr Anchorage, AK 99517
Turnagain NeighborhoodEstimated Value: $381,000 - $1,086,332
4
Beds
2
Baths
2,932
Sq Ft
$250/Sq Ft
Est. Value
About This Home
This home is located at 2303 Chilligan Dr, Anchorage, AK 99517 and is currently estimated at $733,666, approximately $250 per square foot. 2303 Chilligan Dr is a home located in Anchorage Municipality with nearby schools including Turnagain Elementary School, Romig Middle School, and West High School.
Ownership History
Date
Name
Owned For
Owner Type
Purchase Details
Closed on
May 27, 2021
Sold by
Kennedy Thomas J and Karasa Audre J
Bought by
Larsen Jeanne E H and Larsen Mark J
Current Estimated Value
Home Financials for this Owner
Home Financials are based on the most recent Mortgage that was taken out on this home.
Original Mortgage
$722,500
Outstanding Balance
$652,330
Interest Rate
3%
Mortgage Type
New Conventional
Estimated Equity
$81,336
Purchase Details
Closed on
Jun 17, 2009
Sold by
Kennedy Thomas J and Karasa Audre J
Bought by
Kennedy Thomas J and Karasa Audre J
Home Financials for this Owner
Home Financials are based on the most recent Mortgage that was taken out on this home.
Original Mortgage
$450,000
Interest Rate
4.82%
Mortgage Type
New Conventional
Purchase Details
Closed on
Dec 20, 2002
Sold by
Joy Austin John
Bought by
Kennedy Thomas J and Karasa Audra J
Home Financials for this Owner
Home Financials are based on the most recent Mortgage that was taken out on this home.
Original Mortgage
$261,250
Interest Rate
6.03%
Mortgage Type
Purchase Money Mortgage
Create a Home Valuation Report for This Property
The Home Valuation Report is an in-depth analysis detailing your home's value as well as a comparison with similar homes in the area
Home Values in the Area
Average Home Value in this Area
Purchase History
| Date | Buyer | Sale Price | Title Company |
|---|---|---|---|
| Larsen Jeanne E H | -- | None Listed On Document | |
| Larsen Jeanne E H | -- | None Listed On Document | |
| Kennedy Thomas J | -- | Pnt | |
| Kennedy Thomas J | -- | -- |
Source: Public Records
Mortgage History
| Date | Status | Borrower | Loan Amount |
|---|---|---|---|
| Open | Larsen Jeanne E H | $722,500 | |
| Closed | Larsen Jeanne E H | $722,500 | |
| Previous Owner | Kennedy Thomas J | $450,000 | |
| Previous Owner | Kennedy Thomas J | $261,250 |
Source: Public Records
Tax History Compared to Growth
Tax History
| Year | Tax Paid | Tax Assessment Tax Assessment Total Assessment is a certain percentage of the fair market value that is determined by local assessors to be the total taxable value of land and additions on the property. | Land | Improvement |
|---|---|---|---|---|
| 2025 | $11,938 | $850,600 | $266,500 | $584,100 |
| 2024 | $11,938 | $814,400 | $250,000 | $564,400 |
| 2023 | $13,047 | $766,100 | $250,000 | $516,100 |
| 2022 | $12,162 | $772,200 | $250,000 | $522,200 |
| 2021 | $12,780 | $709,200 | $250,000 | $459,200 |
| 2020 | $8,579 | $705,800 | $250,000 | $455,800 |
| 2019 | $10,693 | $703,600 | $250,000 | $453,600 |
| 2018 | $10,744 | $705,100 | $250,000 | $455,100 |
| 2017 | $11,047 | $725,400 | $250,000 | $475,400 |
| 2016 | $10,521 | $718,900 | $250,000 | $468,900 |
| 2015 | $10,521 | $682,100 | $250,000 | $432,100 |
| 2014 | $10,521 | $685,300 | $238,500 | $446,800 |
Source: Public Records
Map
Nearby Homes
- 2401 W Marston Dr
- 3835 Carleton Ave
- 4041 Woronzof Dr
- 4101 Westland Cir
- 3949 Starburst Cir
- 3932 Starburst Cir
- 3161 Horizon St
- 3100 Ward Place Unit 15
- 2906 W 29th Ave
- 3618 Aldren Cir
- 3706 Chaffee Cir
- 3100 W 35th Ave
- 2543 La Honda Dr Unit 7
- 3516 Vintage Cir
- 3517 Vintage Cir
- 2638 Forest Park Dr Unit 112
- 3103 Barbara St
- 2607 W 33rd Ave
- 3900 Crosson Dr
- 2925 W 36th Ave
- 2401 Chilligan Dr
- 2263 Kissee Ct
- 2300 Telequana Dr
- 2408 Telequana Dr
- 2413 Chilligan Dr
- 2245 Kissee Ct
- 2302 Chilligan Dr
- NHN Chilligan Dr
- 000 Chilligan Dr
- 2400 Chilligan Dr
- 2250 Kissee Ct
- 3849 Katmai Cir
- 2435 Chilligan Dr
- 2420 Chilligan Dr
- 2240 Kissee Ct
- 2231 Kissee Ct
- 3829 Katmai Cir
- 2401 Telequana Dr
- 2438 Chilligan Dr
- 2419 Telequana Dr