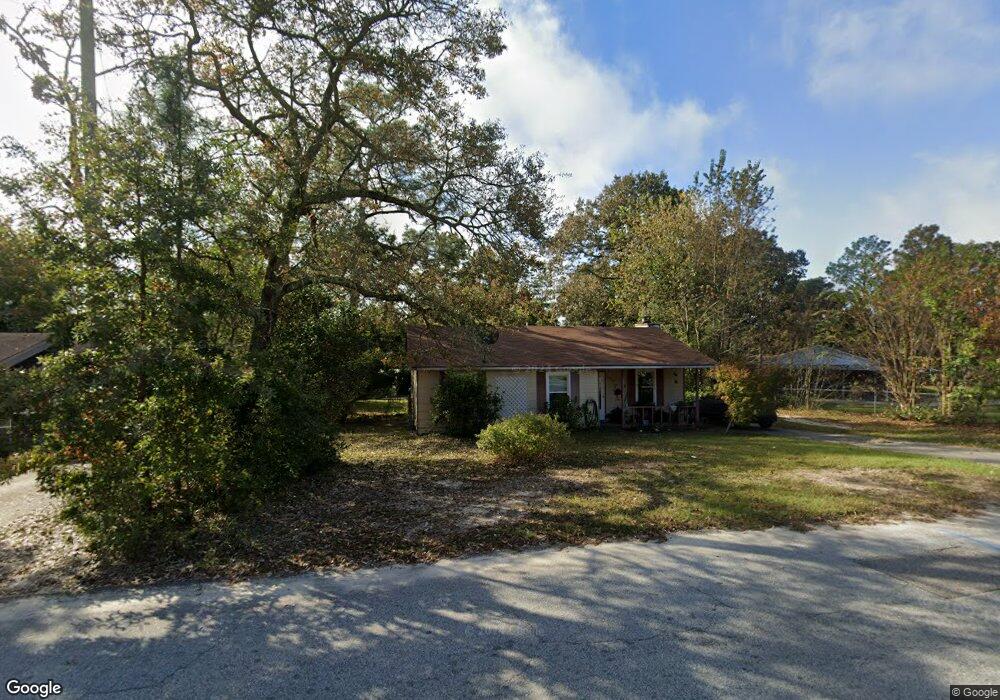
2303 Fieldcrest Rd Augusta, GA 30906
Richmond Factory NeighborhoodEstimated Value: $165,743 - $190,000
3
Beds
2
Baths
1,191
Sq Ft
$145/Sq Ft
Est. Value
About This Home
This home is located at 2303 Fieldcrest Rd, Augusta, GA 30906 and is currently estimated at $173,186, approximately $145 per square foot. 2303 Fieldcrest Rd is a home located in Richmond County with nearby schools including Hephzibah Middle School, Johnson Magnet, and Hephzibah High School.
Ownership History
Date
Name
Owned For
Owner Type
Purchase Details
Closed on
Mar 23, 2000
Sold by
Davis James L and Davis Ethel
Bought by
Kotleski Raymond E and Kotleski Terry H
Current Estimated Value
Home Financials for this Owner
Home Financials are based on the most recent Mortgage that was taken out on this home.
Original Mortgage
$55,046
Outstanding Balance
$17,791
Interest Rate
8.29%
Mortgage Type
FHA
Estimated Equity
$155,395
Purchase Details
Closed on
Nov 8, 1994
Sold by
Tadlock Sara Tadlock Sara C
Bought by
Davis James L Davis Ethel
Purchase Details
Closed on
Nov 2, 1994
Sold by
Tadlock Sara
Bought by
Davis James L
Purchase Details
Closed on
Mar 10, 1993
Sold by
Buchanan Bernice F By Atty
Bought by
Tadlock Sara
Purchase Details
Closed on
Mar 9, 1993
Sold by
Buchanan Bernice F
Bought by
Tadlock Sara
Purchase Details
Closed on
May 8, 1989
Sold by
Mcclain Levinia R O'Neal Levinia Oneal
Bought by
Buchanan Bernice F
Purchase Details
Closed on
Apr 1, 1989
Sold by
Mcclain Levinia R
Bought by
Buchanan Bernice F
Purchase Details
Closed on
Dec 1, 1979
Create a Home Valuation Report for This Property
The Home Valuation Report is an in-depth analysis detailing your home's value as well as a comparison with similar homes in the area
Home Values in the Area
Average Home Value in this Area
Purchase History
| Date | Buyer | Sale Price | Title Company |
|---|---|---|---|
| Kotleski Raymond E | $55,800 | -- | |
| Davis James L Davis Ethel | -- | -- | |
| Davis James L | $8,000 | -- | |
| Tadlock Sara | -- | -- | |
| Tadlock Sara | $36,400 | -- | |
| Buchanan Bernice F | $4,000 | -- | |
| Buchanan Bernice F | $32,500 | -- | |
| -- | $34,100 | -- |
Source: Public Records
Mortgage History
| Date | Status | Borrower | Loan Amount |
|---|---|---|---|
| Open | Kotleski Raymond E | $55,046 |
Source: Public Records
Tax History
| Year | Tax Paid | Tax Assessment Tax Assessment Total Assessment is a certain percentage of the fair market value that is determined by local assessors to be the total taxable value of land and additions on the property. | Land | Improvement |
|---|---|---|---|---|
| 2025 | $1,967 | $60,716 | $6,000 | $54,716 |
| 2024 | $1,967 | $54,356 | $6,000 | $48,356 |
| 2023 | $1,247 | $56,500 | $6,000 | $50,500 |
| 2022 | $1,223 | $34,535 | $6,000 | $28,535 |
| 2021 | $1,096 | $27,788 | $6,000 | $21,788 |
| 2020 | $1,109 | $28,673 | $6,000 | $22,673 |
| 2019 | $1,161 | $28,673 | $6,000 | $22,673 |
| 2018 | $1,168 | $28,673 | $6,000 | $22,673 |
| 2017 | $1,129 | $28,673 | $6,000 | $22,673 |
| 2016 | $1,130 | $28,673 | $6,000 | $22,673 |
| 2015 | $1,137 | $28,673 | $6,000 | $22,673 |
| 2014 | $1,138 | $28,673 | $6,000 | $22,673 |
Source: Public Records
Map
Nearby Homes
- 2383 Richwood Dr
- 4211 Stone Rd
- 4213 Stone Rd
- 4304 Parkwood Dr
- 2264 Basswood Dr
- 4305 Parkwood Dr
- 2348 Fieldcrest Rd
- 2104 Travis Rd
- 4332 Parkwood Dr
- 2219 Travis Rd
- 2357 Basswood Dr
- 2264 Nellie Dr
- 2323 Woodsman Dr
- 2382 Patrick Ave
- 2317 Hiwatha Dr
- 2409 Boykin Rd
- 2369a Plantation Rd
- 2403 Travis Rd
- 304 Suncrest Ct
- 307 Suncrest Ct
- 2305 Fieldcrest Rd
- 2152 Fieldcrest Rd
- 2307 Fieldcrest Rd
- 2305 Rockview Dr
- 3810 Southfield Dr
- 2307 Rockview Dr
- 2303 Rockview Dr
- 2302 Fieldcrest Rd
- 2304 Fieldcrest Rd
- 2309 Fieldcrest Rd
- 3809 Southfield Dr
- 2309 Rockview Dr
- 2306 Fieldcrest Rd
- 3812 Southfield Dr
- 3811 Southfield Dr
- 2301 Rockview Dr
- 2308 Fieldcrest Rd
- 2310 Fieldcrest Rd
- 3813 Southfield Dr
- 2312 Fieldcrest Rd
Your Personal Tour Guide
Ask me questions while you tour the home.