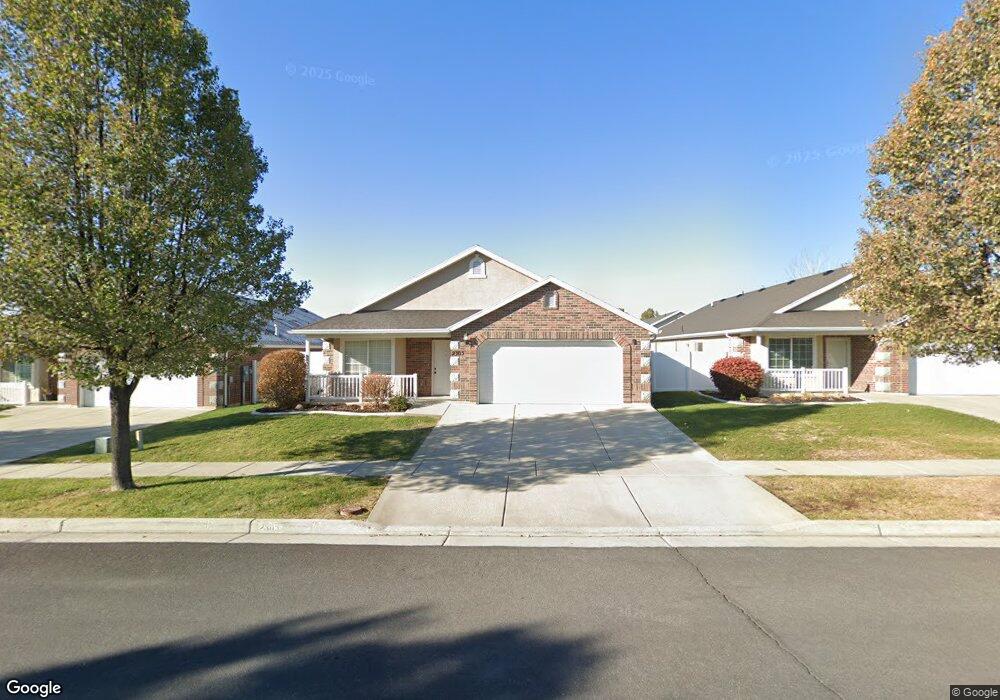
2303 Garden Ln Unit 35 Layton, UT 84041
Estimated Value: $463,239 - $524,000
3
Beds
2
Baths
1,998
Sq Ft
$243/Sq Ft
Est. Value
About This Home
This home is located at 2303 Garden Ln Unit 35, Layton, UT 84041 and is currently estimated at $485,310, approximately $242 per square foot. 2303 Garden Ln Unit 35 is a home located in Davis County with nearby schools including Lincoln Elementary School, North Layton Junior High School, and Northridge High School.
Ownership History
Date
Name
Owned For
Owner Type
Purchase Details
Closed on
Nov 25, 2008
Sold by
Summit Capital Investments Lc
Bought by
Smith Francis Pearl
Current Estimated Value
Home Financials for this Owner
Home Financials are based on the most recent Mortgage that was taken out on this home.
Original Mortgage
$153,174
Outstanding Balance
$103,022
Interest Rate
6.5%
Mortgage Type
Purchase Money Mortgage
Estimated Equity
$382,288
Purchase Details
Closed on
Nov 19, 2007
Sold by
Summit Capital Investments Lc
Bought by
Smith Francis Pearl
Purchase Details
Closed on
Nov 16, 2007
Sold by
Colonial Builders Group Llc
Bought by
Summit Capital Investments Lc
Purchase Details
Closed on
May 30, 2007
Sold by
Greater Utah Land Investment Llc
Bought by
Colonial Builders Group Llc
Home Financials for this Owner
Home Financials are based on the most recent Mortgage that was taken out on this home.
Original Mortgage
$212,537
Interest Rate
6.12%
Mortgage Type
Purchase Money Mortgage
Create a Home Valuation Report for This Property
The Home Valuation Report is an in-depth analysis detailing your home's value as well as a comparison with similar homes in the area
Home Values in the Area
Average Home Value in this Area
Purchase History
| Date | Buyer | Sale Price | Title Company |
|---|---|---|---|
| Smith Francis Pearl | -- | Lincoln Title Ins Agency | |
| Smith Francis Pearl | -- | Lincoln Title Ins Agency | |
| Summit Capital Investments Lc | -- | Lincoln Title Ins Agency | |
| Colonial Builders Group Llc | -- | Lincoln Title Ins Agency |
Source: Public Records
Mortgage History
| Date | Status | Borrower | Loan Amount |
|---|---|---|---|
| Open | Smith Francis Pearl | $153,174 | |
| Previous Owner | Colonial Builders Group Llc | $212,537 |
Source: Public Records
Tax History Compared to Growth
Tax History
| Year | Tax Paid | Tax Assessment Tax Assessment Total Assessment is a certain percentage of the fair market value that is determined by local assessors to be the total taxable value of land and additions on the property. | Land | Improvement |
|---|---|---|---|---|
| 2024 | $2,429 | $256,850 | $52,250 | $204,600 |
| 2023 | $2,468 | $253,000 | $50,050 | $202,950 |
| 2022 | $2,554 | $470,000 | $83,000 | $387,000 |
| 2021 | $2,398 | $362,000 | $69,000 | $293,000 |
| 2020 | $2,168 | $314,000 | $51,000 | $263,000 |
| 2019 | $2,122 | $301,000 | $49,000 | $252,000 |
| 2018 | $1,973 | $281,000 | $49,000 | $232,000 |
| 2016 | $1,860 | $136,620 | $26,950 | $109,670 |
| 2015 | $1,752 | $122,155 | $26,950 | $95,205 |
| 2014 | $358 | $125,409 | $18,333 | $107,076 |
| 2013 | -- | $113,300 | $42,911 | $70,389 |
Source: Public Records
Map
Nearby Homes
- 781 W 2150 N
- 2402 N 725 W
- 2378 N 675 W
- 2211 N 525 W
- 2187 N 450 W
- 2887 N 1175 W
- 1606 W 1960 N
- 1094 N Angel St W
- 2949 N 1175 W
- 1413 W 1650 N
- 1665 W 1960 N
- 1548 E 925 S
- 850 S 1650 E Unit D
- 1615 N Angel St Unit E
- 1615 N Angel St Unit H
- 1615 N Angel St Unit I
- 1615 N Angel St Unit F
- 1615 N Angel St Unit G
- 1615 N Angel St
- 1615 N Angel St Unit D
- 2303 Garden Ln
- 2315 Garden Ln Unit 34
- 2315 Garden Ln
- 2291 Garden Ln Unit 36
- 2327 Garden Ln Unit 33
- 2266 N 1085 W Unit 43
- 2260 N 1085 W Unit 44
- 2278 N 1085 W Unit 42
- 2333 Garden Ln Unit 32
- 1016 W 2250 N Unit 13
- 2284 N 1085 W Unit 41
- 2312 Garden Ln Unit 14
- 2322 Garden Ln Unit 15
- 2298 N 1085 W Unit 40
- 1037 W 2250 N Unit 2
- 1049 W 2250 N Unit 1
- 1008 W 2250 N Unit 12
- 1008 W 2250 N
- 1065 W 2250 N
- 2265 N 1085 W Unit 48