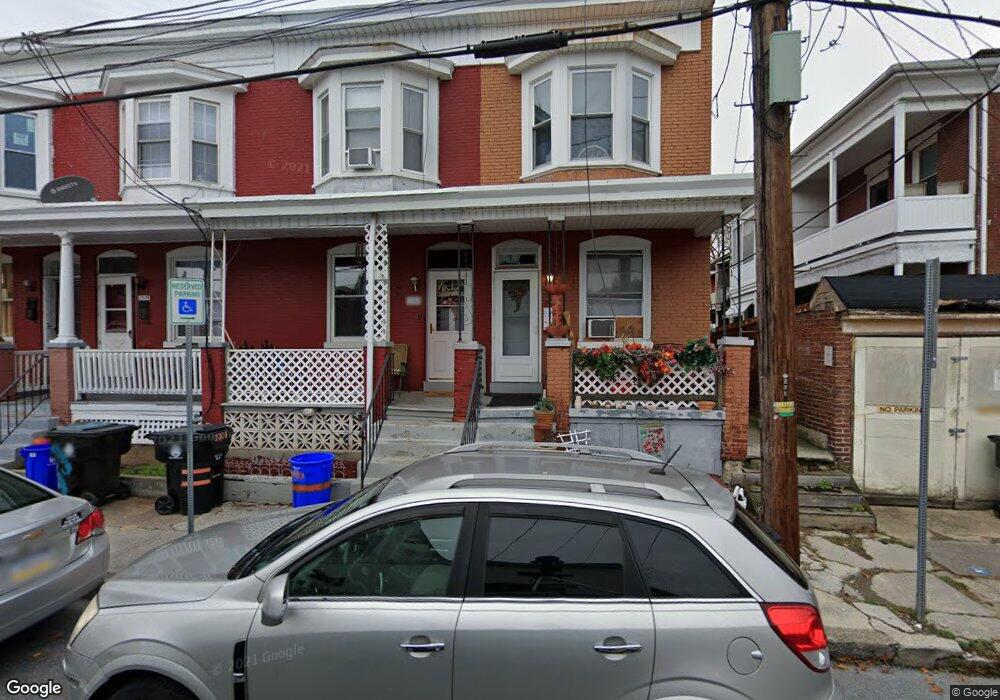
2303 Logan St Harrisburg, PA 17110
Uptown Harrisburg NeighborhoodEstimated Value: $57,000 - $116,000
3
Beds
1
Bath
1,142
Sq Ft
$77/Sq Ft
Est. Value
About This Home
This home is located at 2303 Logan St, Harrisburg, PA 17110 and is currently estimated at $87,619, approximately $76 per square foot. 2303 Logan St is a home located in Dauphin County with nearby schools including Camp Curtin Academy, Harrisburg High School, and Harrisburg Catholic Elementary School.
Ownership History
Date
Name
Owned For
Owner Type
Purchase Details
Closed on
Jan 16, 2019
Sold by
Arnold Matthew D
Bought by
Stridiron Shawn Edward and Stridiron Shanann M
Current Estimated Value
Home Financials for this Owner
Home Financials are based on the most recent Mortgage that was taken out on this home.
Original Mortgage
$29,100
Outstanding Balance
$25,585
Interest Rate
4.6%
Mortgage Type
New Conventional
Estimated Equity
$62,034
Create a Home Valuation Report for This Property
The Home Valuation Report is an in-depth analysis detailing your home's value as well as a comparison with similar homes in the area
Home Values in the Area
Average Home Value in this Area
Purchase History
| Date | Buyer | Sale Price | Title Company |
|---|---|---|---|
| Stridiron Shawn Edward | $30,000 | None Available |
Source: Public Records
Mortgage History
| Date | Status | Borrower | Loan Amount |
|---|---|---|---|
| Open | Stridiron Shawn Edward | $29,100 |
Source: Public Records
Tax History Compared to Growth
Tax History
| Year | Tax Paid | Tax Assessment Tax Assessment Total Assessment is a certain percentage of the fair market value that is determined by local assessors to be the total taxable value of land and additions on the property. | Land | Improvement |
|---|---|---|---|---|
| 2025 | $1,054 | $18,800 | $8,300 | $10,500 |
| 2024 | $1,026 | $18,800 | $8,300 | $10,500 |
| 2023 | $1,026 | $18,800 | $8,300 | $10,500 |
| 2022 | $1,007 | $18,800 | $8,300 | $10,500 |
| 2021 | $1,007 | $18,800 | $8,300 | $10,500 |
| 2020 | $1,007 | $18,800 | $8,300 | $10,500 |
| 2019 | $989 | $18,800 | $8,300 | $10,500 |
| 2018 | $970 | $18,800 | $8,300 | $10,500 |
| 2017 | $970 | $18,800 | $8,300 | $10,500 |
| 2016 | $834 | $18,800 | $8,300 | $10,500 |
| 2015 | -- | $27,300 | $8,300 | $19,000 |
| 2014 | -- | $27,300 | $8,300 | $19,000 |
Source: Public Records
Map
Nearby Homes