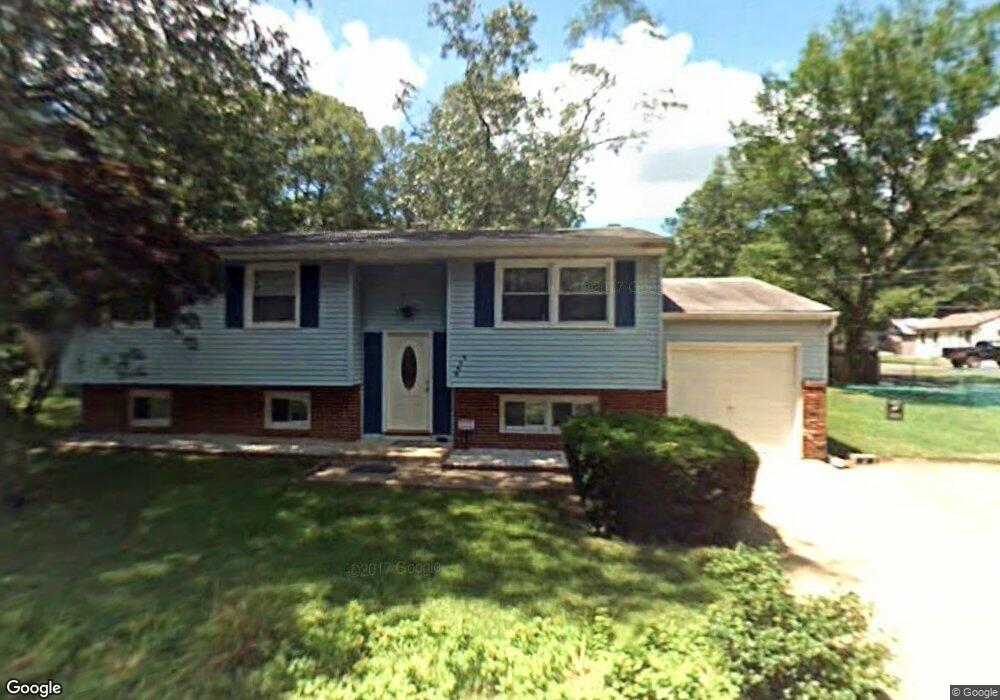
2303 N Lakeshore Dr Browns Mills, NJ 08015
Estimated Value: $308,552 - $362,000
--
Bed
--
Bath
1,657
Sq Ft
$204/Sq Ft
Est. Value
About This Home
This home is located at 2303 N Lakeshore Dr, Browns Mills, NJ 08015 and is currently estimated at $338,638, approximately $204 per square foot. 2303 N Lakeshore Dr is a home located in Burlington County.
Ownership History
Date
Name
Owned For
Owner Type
Purchase Details
Closed on
Jul 31, 2008
Sold by
Vrablic Velez Yarie X and Vrablic Jeremy S
Bought by
Vrablic Jeremy S
Current Estimated Value
Purchase Details
Closed on
Jan 28, 2005
Sold by
Cheatom Theodis and Cheatom Cecelia
Bought by
Vrablic Jeremy S and Rablic Velez Yarie
Home Financials for this Owner
Home Financials are based on the most recent Mortgage that was taken out on this home.
Original Mortgage
$185,402
Outstanding Balance
$94,423
Interest Rate
5.78%
Mortgage Type
VA
Estimated Equity
$244,215
Purchase Details
Closed on
Aug 22, 1995
Sold by
Steward Ronald and Cheatom Theodis
Bought by
Cheatom Theodis and Cheatom Cecelia
Create a Home Valuation Report for This Property
The Home Valuation Report is an in-depth analysis detailing your home's value as well as a comparison with similar homes in the area
Home Values in the Area
Average Home Value in this Area
Purchase History
| Date | Buyer | Sale Price | Title Company |
|---|---|---|---|
| Vrablic Jeremy S | -- | None Available | |
| Vrablic Jeremy S | $181,500 | Group 21 Title Agency | |
| Cheatom Theodis | -- | -- | |
| Cheatom Theodis | -- | -- |
Source: Public Records
Mortgage History
| Date | Status | Borrower | Loan Amount |
|---|---|---|---|
| Open | Vrablic Jeremy S | $185,402 |
Source: Public Records
Tax History Compared to Growth
Tax History
| Year | Tax Paid | Tax Assessment Tax Assessment Total Assessment is a certain percentage of the fair market value that is determined by local assessors to be the total taxable value of land and additions on the property. | Land | Improvement |
|---|---|---|---|---|
| 2025 | $5,024 | $163,900 | $38,800 | $125,100 |
| 2024 | $4,714 | $163,900 | $38,800 | $125,100 |
| 2023 | $4,714 | $163,900 | $38,800 | $125,100 |
| 2022 | $4,363 | $163,900 | $38,800 | $125,100 |
| 2021 | $3,914 | $163,900 | $38,800 | $125,100 |
| 2020 | $4,027 | $163,900 | $38,800 | $125,100 |
| 2019 | $3,857 | $163,900 | $38,800 | $125,100 |
| 2018 | $3,725 | $163,900 | $38,800 | $125,100 |
| 2017 | $3,648 | $163,900 | $38,800 | $125,100 |
| 2016 | $3,588 | $96,000 | $22,100 | $73,900 |
| 2015 | $3,560 | $96,000 | $22,100 | $73,900 |
| 2014 | $3,403 | $96,000 | $22,100 | $73,900 |
Source: Public Records
Map
Nearby Homes