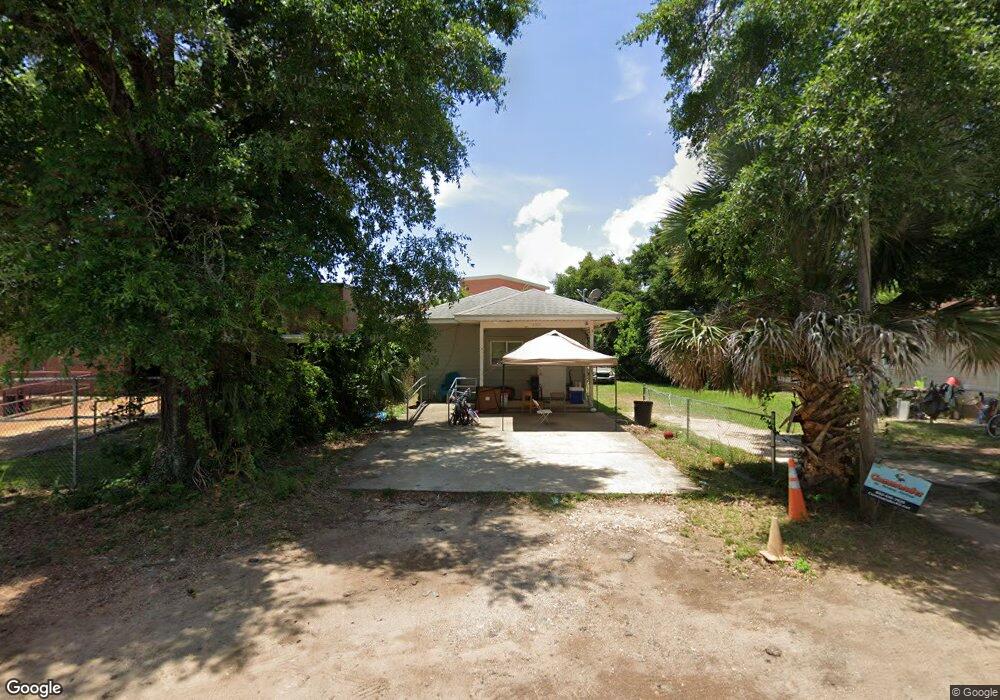
2303 N Spring St Pensacola, FL 32501
Estimated Value: $145,000 - $220,000
--
Bed
1
Bath
965
Sq Ft
$177/Sq Ft
Est. Value
About This Home
This home is located at 2303 N Spring St, Pensacola, FL 32501 and is currently estimated at $170,822, approximately $177 per square foot. 2303 N Spring St is a home located in Escambia County with nearby schools including O.J. Semmes Elementary School, Warrington Middle School, and Pensacola High School.
Ownership History
Date
Name
Owned For
Owner Type
Purchase Details
Closed on
Oct 2, 2025
Sold by
Moorer-Gordon Ann Marie and Moorer Joe Wilson
Bought by
Clear Sight Properties Llc
Current Estimated Value
Home Financials for this Owner
Home Financials are based on the most recent Mortgage that was taken out on this home.
Original Mortgage
$72,000
Outstanding Balance
$72,000
Interest Rate
6.58%
Mortgage Type
Credit Line Revolving
Estimated Equity
$98,822
Create a Home Valuation Report for This Property
The Home Valuation Report is an in-depth analysis detailing your home's value as well as a comparison with similar homes in the area
Home Values in the Area
Average Home Value in this Area
Purchase History
| Date | Buyer | Sale Price | Title Company |
|---|---|---|---|
| Clear Sight Properties Llc | $90,000 | Clear Title |
Source: Public Records
Mortgage History
| Date | Status | Borrower | Loan Amount |
|---|---|---|---|
| Open | Clear Sight Properties Llc | $72,000 |
Source: Public Records
Tax History Compared to Growth
Tax History
| Year | Tax Paid | Tax Assessment Tax Assessment Total Assessment is a certain percentage of the fair market value that is determined by local assessors to be the total taxable value of land and additions on the property. | Land | Improvement |
|---|---|---|---|---|
| 2024 | $1,712 | $130,896 | $11,448 | $119,448 |
| 2023 | $1,712 | $117,973 | $0 | $0 |
| 2022 | $1,562 | $107,249 | $5,247 | $102,002 |
| 2021 | $1,309 | $86,432 | $0 | $0 |
| 2020 | $1,176 | $77,122 | $0 | $0 |
| 2019 | $1,129 | $73,044 | $0 | $0 |
| 2018 | $1,091 | $68,865 | $0 | $0 |
| 2017 | $1,078 | $66,468 | $0 | $0 |
| 2016 | $657 | $54,695 | $0 | $0 |
| 2015 | $637 | $54,315 | $0 | $0 |
| 2014 | $497 | $53,884 | $0 | $0 |
Source: Public Records
Map
Nearby Homes
- 9 W Yonge St
- 100 W Scott St
- 2005 N Baylen St
- 631 W Jordan St
- 100 E Maxwell St
- 110 E Bobe St
- 1806 N Barcelona St
- 811 W Jordan St
- 114 E Maxwell St
- 2514 N Guillemard St
- 110 E Jordan St
- 200 E Yonge St
- 821 W Hernandez St
- 400 BLK N Palafox St
- 1750 N Reus St
- 2363 N F St
- 215 E Bobe St
- 2014 N Tarragona St
- 205 E Hatton St
- 1500 BLK W Jordan St
- 2305 N Spring St
- 2307 N Spring St
- 2309 N Spring St
- 2315 N Spring St
- 2317 N Spring St
- 2302 N Spring St
- 2308 N Spring St
- 2312 N Spring St
- 2319 N Spring St
- 2314 N Spring St
- 109 W Yonge St
- 104 W Bobe St Unit 3
- 104 W Bobe St Unit 2
- 104 W Bobe St
- 2401 N Spring St Unit A
- 102 W Bobe St
- 2403 N Spring St
- 106 W Yonge St
- 2432 N Spring St
- 2309 N Baylen St