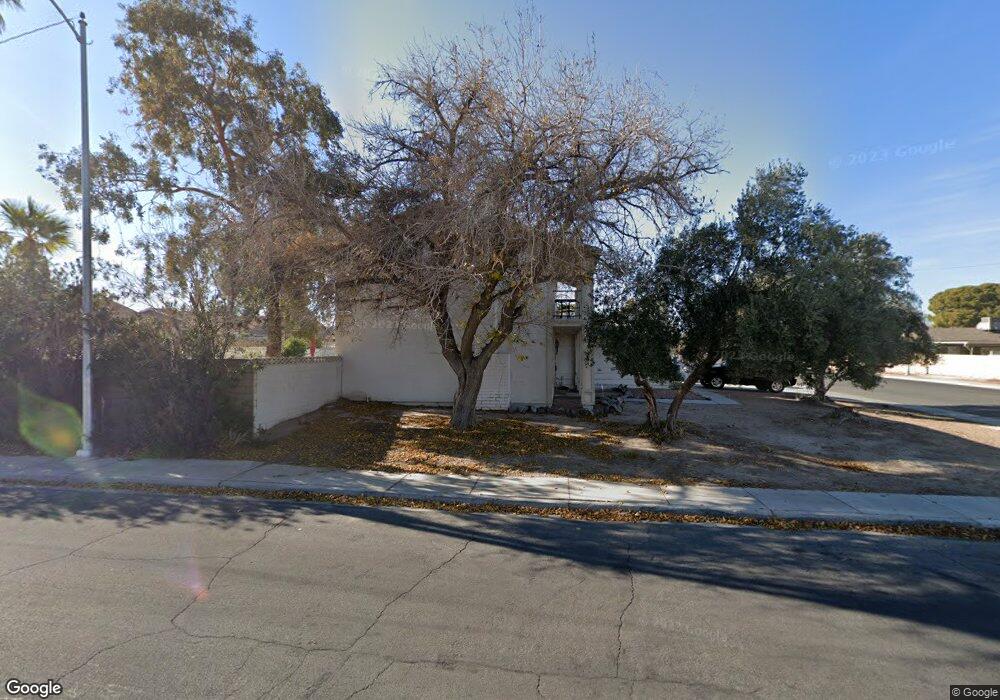
2303 Rawhide St Las Vegas, NV 89119
University District NeighborhoodEstimated Value: $431,000 - $468,000
4
Beds
3
Baths
1,974
Sq Ft
$226/Sq Ft
Est. Value
About This Home
This home is located at 2303 Rawhide St, Las Vegas, NV 89119 and is currently estimated at $446,114, approximately $225 per square foot. 2303 Rawhide St is a home located in Clark County with nearby schools including Jack Dailey Elementary School, Gene Ward Elementary School, and Helen C. Cannon Junior High School.
Ownership History
Date
Name
Owned For
Owner Type
Purchase Details
Closed on
Jun 2, 2024
Sold by
Urgitano Angela J
Bought by
Garofalo Alex A
Current Estimated Value
Purchase Details
Closed on
Oct 23, 2023
Sold by
Garofalo Alessandro A
Bought by
Urgitano Angela J
Purchase Details
Closed on
Nov 19, 2014
Sold by
Silver Angela J
Bought by
Garofalo Alessandro A
Purchase Details
Closed on
May 6, 2009
Sold by
Garofalo Alessandro A
Bought by
Silver Angela J
Purchase Details
Closed on
Apr 30, 2009
Sold by
Garofalo Alessandro A
Bought by
Garofalo Alessandro A
Purchase Details
Closed on
Apr 8, 2009
Sold by
Garofalo Alessandro A
Bought by
Silver Angela J
Purchase Details
Closed on
Mar 4, 2009
Sold by
Garofalo Alessandro G
Bought by
Garofalo Alessandro A
Purchase Details
Closed on
Dec 17, 1997
Sold by
Garofalo Ida M
Bought by
Garofalo Alessandro G
Create a Home Valuation Report for This Property
The Home Valuation Report is an in-depth analysis detailing your home's value as well as a comparison with similar homes in the area
Home Values in the Area
Average Home Value in this Area
Purchase History
| Date | Buyer | Sale Price | Title Company |
|---|---|---|---|
| Garofalo Alex A | $164,291 | None Listed On Document | |
| Urgitano Angela J | $164,291 | None Listed On Document | |
| Garofalo Alessandro A | $103,483 | None Available | |
| Silver Angela J | -- | None Available | |
| Garofalo Alessandro A | -- | None Available | |
| Silver Angela J | -- | None Available | |
| Garofalo Alessandro A | -- | None Available | |
| Garofalo Alessandro G | -- | -- |
Source: Public Records
Tax History Compared to Growth
Tax History
| Year | Tax Paid | Tax Assessment Tax Assessment Total Assessment is a certain percentage of the fair market value that is determined by local assessors to be the total taxable value of land and additions on the property. | Land | Improvement |
|---|---|---|---|---|
| 2025 | $1,221 | $63,600 | $31,500 | $32,100 |
| 2024 | $1,272 | $63,600 | $31,500 | $32,100 |
| 2023 | $1,272 | $57,502 | $28,700 | $28,802 |
| 2022 | $1,152 | $53,870 | $28,000 | $25,870 |
| 2021 | $1,119 | $48,894 | $24,850 | $24,044 |
| 2020 | $1,083 | $46,131 | $22,750 | $23,381 |
| 2019 | $1,070 | $44,489 | $20,650 | $23,839 |
| 2018 | $1,021 | $42,200 | $18,550 | $23,650 |
| 2017 | $1,208 | $41,206 | $16,450 | $24,756 |
| 2016 | $957 | $38,296 | $11,900 | $26,396 |
| 2015 | $954 | $36,219 | $9,450 | $26,769 |
| 2014 | $924 | $30,567 | $7,000 | $23,567 |
Source: Public Records
Map
Nearby Homes
- 5473 Clydesdale St
- 5433 Latigo St
- 5473 S Eastern Ave
- 2184 Sunnyslope Ave
- 2246 E Russell Rd
- 2174 E Russell Rd
- 2033 Pommel Ave
- 5399 Surrey St
- 1963 Rawhide St
- 5551 Corral Cir
- 2486 Leigh Ave
- 5514 Oxbow St
- 5613 Chestnut St
- 5375 Chestnut St
- 5167 Martingale Ave
- 5328 Topaz St
- 2625 E Russell Rd
- 5143 Martingale Ave
- 1673 Caliente Ct
- 5086 Jeffreys St Unit 201
- 2285 Rawhide St
- 2304 Roan Ave
- 2284 Roan Ave
- 2333 Rawhide St
- 2265 Rawhide St
- 5485 Clydesdale St
- 2336 Roan Ave
- 2264 Roan Ave
- 5486 Percheron St
- 5486 Clydesdale St
- 2345 Rawhide St
- 2247 Rawhide St
- 2244 Roan Ave
- 5474 Percheron St
- 5474 Clydesdale St
- 2299 Roan Ave
- 2279 Roan Ave
- 2353 Rawhide St
- 2229 Rawhide St
- 5485 Latigo St