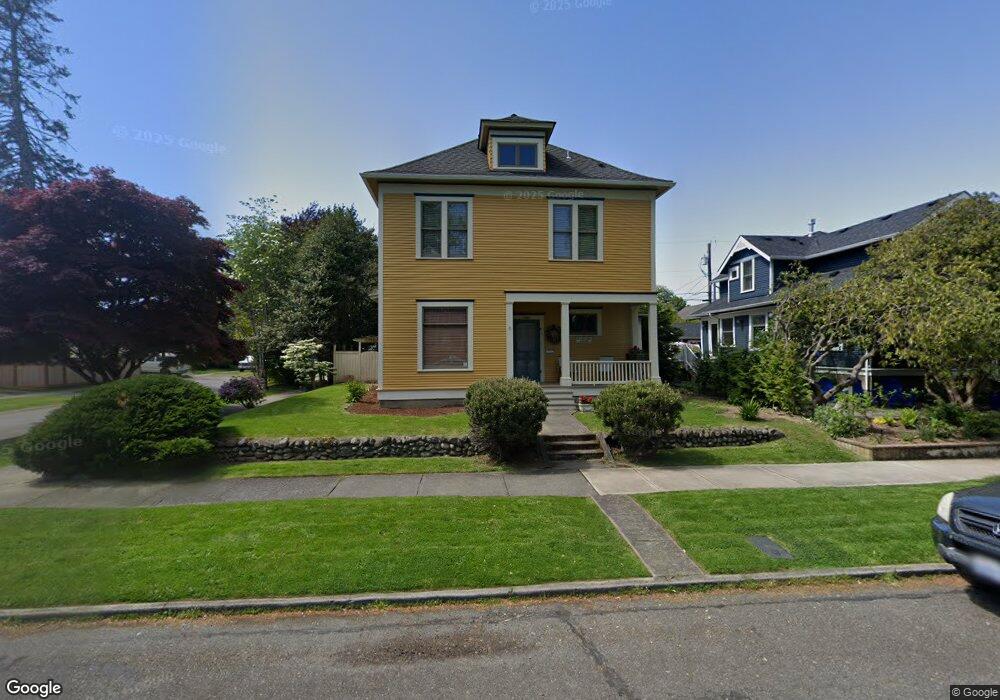
2303 Utter St Bellingham, WA 98225
Columbia NeighborhoodEstimated Value: $861,000 - $1,044,000
4
Beds
2
Baths
2,117
Sq Ft
$457/Sq Ft
Est. Value
About This Home
This home is located at 2303 Utter St, Bellingham, WA 98225 and is currently estimated at $967,733, approximately $457 per square foot. 2303 Utter St is a home located in Whatcom County with nearby schools including Columbia Elementary School, Whatcom Middle School, and Bellingham High School.
Ownership History
Date
Name
Owned For
Owner Type
Purchase Details
Closed on
May 24, 2002
Sold by
Denola Robert C and Schaefer Mary R
Bought by
Wesson Robert C and Wesson Kathleen P
Current Estimated Value
Home Financials for this Owner
Home Financials are based on the most recent Mortgage that was taken out on this home.
Original Mortgage
$218,500
Outstanding Balance
$89,261
Interest Rate
6.89%
Estimated Equity
$878,472
Create a Home Valuation Report for This Property
The Home Valuation Report is an in-depth analysis detailing your home's value as well as a comparison with similar homes in the area
Home Values in the Area
Average Home Value in this Area
Purchase History
| Date | Buyer | Sale Price | Title Company |
|---|---|---|---|
| Wesson Robert C | $230,000 | Stewart Title Company |
Source: Public Records
Mortgage History
| Date | Status | Borrower | Loan Amount |
|---|---|---|---|
| Open | Wesson Robert C | $218,500 |
Source: Public Records
Tax History
| Year | Tax Paid | Tax Assessment Tax Assessment Total Assessment is a certain percentage of the fair market value that is determined by local assessors to be the total taxable value of land and additions on the property. | Land | Improvement |
|---|---|---|---|---|
| 2025 | $8,619 | $1,084,823 | $279,056 | $805,767 |
| 2024 | $8,402 | $1,053,226 | $270,928 | $782,298 |
| 2023 | $8,402 | $1,080,034 | $277,824 | $802,210 |
| 2022 | $6,240 | $931,066 | $239,504 | $691,562 |
| 2021 | $6,122 | $671,756 | $172,800 | $498,956 |
| 2020 | $6,276 | $621,996 | $160,000 | $461,996 |
| 2019 | $5,619 | $616,394 | $124,778 | $491,616 |
| 2018 | $5,658 | $553,268 | $112,028 | $441,240 |
| 2017 | $4,887 | $476,349 | $96,450 | $379,899 |
| 2016 | $4,273 | $430,000 | $86,550 | $343,450 |
| 2015 | $4,190 | $391,385 | $79,050 | $312,335 |
| 2014 | -- | $371,333 | $75,000 | $296,333 |
| 2013 | -- | $372,751 | $73,500 | $299,251 |
Source: Public Records
Map
Nearby Homes
- 2414 Elm St
- 1315 Astor St
- 1310 Ellsworth St
- 2404 Cherry St
- 2600 Elm St
- 1200 W Holly St
- 2609 Jaeger St
- 1310 G St
- 2525 Monroe St
- 2500 Cornwall Ave
- 2011 Cornwall Ave
- 1420 E Maplewood Ave
- 1112 Cornwall Ave
- 2216 Dean Ave
- 3045 Eldridge Ave Unit A
- 2905 Cedarwood Ave
- 2905 Cedarwood Ave
- 1310 Railroad Ave
- 2950 Plymouth Dr
- 409 Kentucky St
- 2305 Utter St
- 10 Washington St
- 2309 Utter St
- 1701 Washington St
- 1708 Washington St
- 2304 Williams St
- 2310 Williams St
- 2300 Utter St
- 2225 Utter St
- 2304 Utter St
- 2230 Williams St
- 2308 Utter St
- 2230 Utter St
- 12222 CI Undisclosed
- 2314 Williams St
- 2223 Utter St
- 12222 Undisclosed
- 2314 Utter St
- 2224 Utter St
Your Personal Tour Guide
Ask me questions while you tour the home.