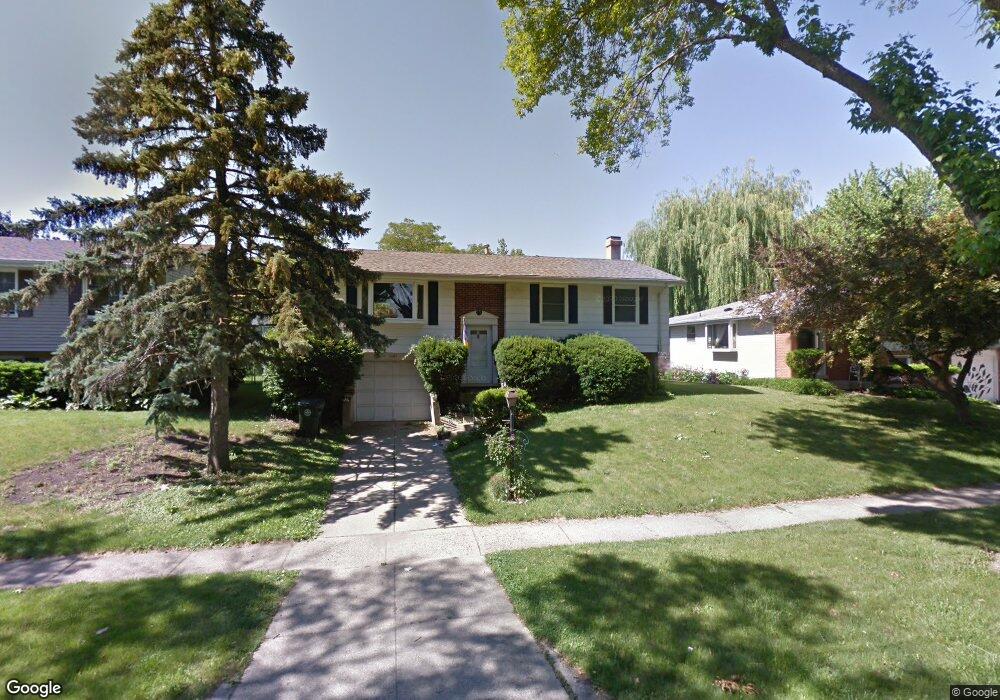
2303 Willow Ln Rolling Meadows, IL 60008
Busse Woods NeighborhoodEstimated Value: $342,000 - $396,000
4
Beds
2
Baths
1,600
Sq Ft
$225/Sq Ft
Est. Value
About This Home
This home is located at 2303 Willow Ln, Rolling Meadows, IL 60008 and is currently estimated at $360,413, approximately $225 per square foot. 2303 Willow Ln is a home located in Cook County with nearby schools including Willow Bend Elementary School, Carl Sandburg Junior High School, and Rolling Meadows High School.
Ownership History
Date
Name
Owned For
Owner Type
Purchase Details
Closed on
Jul 19, 2018
Sold by
Everson Steven C and Everson Lois
Bought by
Osmancevic Amir and Botic Mehmed
Current Estimated Value
Home Financials for this Owner
Home Financials are based on the most recent Mortgage that was taken out on this home.
Original Mortgage
$160,000
Outstanding Balance
$137,789
Interest Rate
4.5%
Mortgage Type
New Conventional
Estimated Equity
$222,625
Purchase Details
Closed on
Sep 12, 2005
Sold by
Standard Bank & Trust Co
Bought by
Everson Steven C
Purchase Details
Closed on
Nov 22, 2004
Sold by
Everson Steven C
Bought by
Standard Bank & Trust Co and Trust #17421
Home Financials for this Owner
Home Financials are based on the most recent Mortgage that was taken out on this home.
Original Mortgage
$116,500
Interest Rate
5.71%
Mortgage Type
Unknown
Create a Home Valuation Report for This Property
The Home Valuation Report is an in-depth analysis detailing your home's value as well as a comparison with similar homes in the area
Home Values in the Area
Average Home Value in this Area
Purchase History
| Date | Buyer | Sale Price | Title Company |
|---|---|---|---|
| Osmancevic Amir | $200,000 | Greater Illinois Title | |
| Everson Steven C | -- | -- | |
| Standard Bank & Trust Co | -- | -- | |
| Everson Steven C | -- | Git |
Source: Public Records
Mortgage History
| Date | Status | Borrower | Loan Amount |
|---|---|---|---|
| Open | Osmancevic Amir | $160,000 | |
| Previous Owner | Everson Steven C | $116,500 |
Source: Public Records
Tax History
| Year | Tax Paid | Tax Assessment Tax Assessment Total Assessment is a certain percentage of the fair market value that is determined by local assessors to be the total taxable value of land and additions on the property. | Land | Improvement |
|---|---|---|---|---|
| 2025 | $6,012 | $23,000 | $7,410 | $15,590 |
| 2024 | $6,012 | $23,000 | $6,240 | $16,760 |
| 2023 | $5,721 | $23,000 | $6,240 | $16,760 |
| 2022 | $5,721 | $23,000 | $6,240 | $16,760 |
| 2021 | $5,190 | $19,085 | $3,900 | $15,185 |
| 2020 | $5,141 | $19,085 | $3,900 | $15,185 |
| 2019 | $5,144 | $21,206 | $3,900 | $17,306 |
| 2018 | $5,879 | $21,671 | $3,510 | $18,161 |
| 2017 | $5,779 | $21,671 | $3,510 | $18,161 |
| 2016 | $5,641 | $21,671 | $3,510 | $18,161 |
| 2015 | $4,666 | $17,517 | $2,925 | $14,592 |
| 2014 | $4,572 | $17,517 | $2,925 | $14,592 |
| 2013 | $4,444 | $17,517 | $2,925 | $14,592 |
Source: Public Records
Map
Nearby Homes
- 2508 Algonquin Rd Unit 16
- 1117 S Old Wilke Rd Unit 206
- 1227 S Old Wilke Rd Unit 306
- 1126 S New Wilke Rd Unit 307
- 1107 S Old Wilke Rd Unit 103
- 1107 S Old Wilke Rd Unit 208
- 2830 Northampton Dr Unit A1
- 1322 S New Wilke Rd Unit 1C
- 5000 Carriageway Dr Unit 211
- 2302 Fulle St
- 5001 Carriage Way Dr Unit 116
- 5201 Carriageway Dr Unit C317
- 5400 Astor Ln Unit 116
- 1302 S Princeton Ave
- 5450 Astor Ln Unit 104
- 5450 Astor Ln Unit 415
- 5576 Lavender Ct Unit 3202
- 1418 S Princeton Ave
- 1107 W White Oak St
- 837 S Dwyer Ave Unit A
Your Personal Tour Guide
Ask me questions while you tour the home.