Estimated Value: $543,000
3
Beds
3
Baths
2,821
Sq Ft
$192/Sq Ft
Est. Value
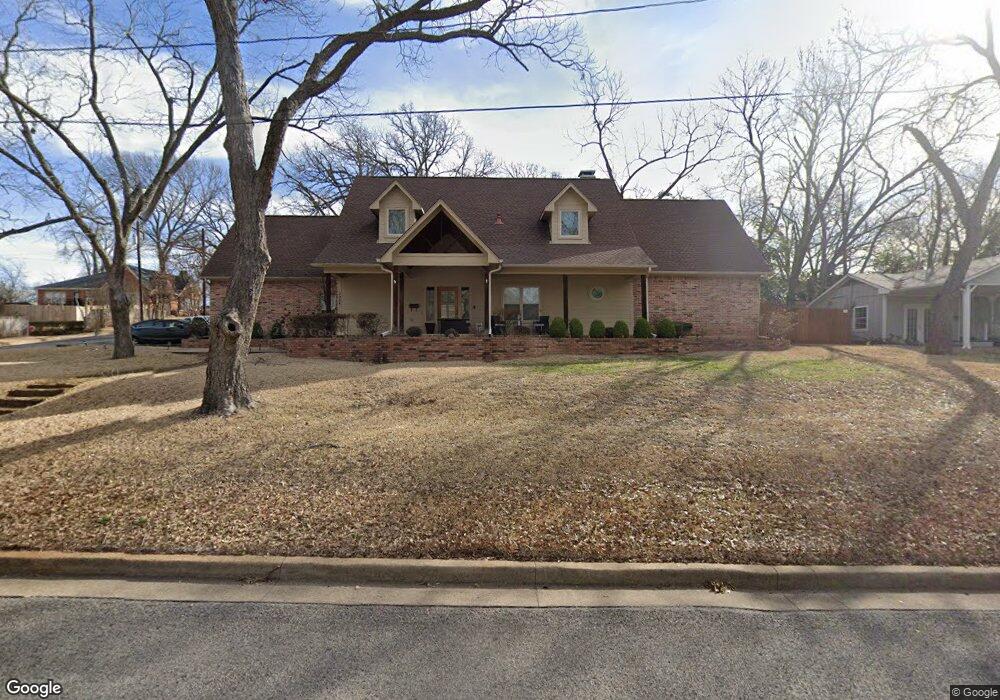
About This Home
This home is located at 2304 Copeland Rd, Tyler, TX 75701 and is currently priced at $543,000, approximately $192 per square foot. 2304 Copeland Rd is a home located in Smith County with nearby schools including Woods Elementary School, Hubbard Middle School, and Tyler Legacy High School.
Ownership History
Date
Name
Owned For
Owner Type
Purchase Details
Closed on
Jul 15, 2020
Sold by
Ralson Brian D and Ralson Sherri C
Bought by
Pedroza Armando S and Gonzalez Prycila M
Current Estimated Value
Home Financials for this Owner
Home Financials are based on the most recent Mortgage that was taken out on this home.
Original Mortgage
$327,257
Outstanding Balance
$289,542
Interest Rate
3.1%
Mortgage Type
VA
Purchase Details
Closed on
Sep 16, 2016
Sold by
Cooper Charles F and Cooper Robbie J
Bought by
Ralson Sherri
Purchase Details
Closed on
Jan 23, 2015
Sold by
Halford Jim and Halford Ginger
Bought by
Ralson Brian D and Ralson Sherri C
Home Financials for this Owner
Home Financials are based on the most recent Mortgage that was taken out on this home.
Original Mortgage
$204,000
Interest Rate
3.97%
Mortgage Type
New Conventional
Create a Home Valuation Report for This Property
The Home Valuation Report is an in-depth analysis detailing your home's value as well as a comparison with similar homes in the area
Home Values in the Area
Average Home Value in this Area
Purchase History
| Date | Buyer | Sale Price | Title Company |
|---|---|---|---|
| Pedroza Armando S | -- | None Available | |
| Ralson Sherri | -- | None Available | |
| Ralson Brian D | -- | East Texas Title Co |
Source: Public Records
Mortgage History
| Date | Status | Borrower | Loan Amount |
|---|---|---|---|
| Open | Pedroza Armando S | $327,257 | |
| Previous Owner | Ralson Brian D | $204,000 |
Source: Public Records
Tax History Compared to Growth
Tax History
| Year | Tax Paid | Tax Assessment Tax Assessment Total Assessment is a certain percentage of the fair market value that is determined by local assessors to be the total taxable value of land and additions on the property. | Land | Improvement |
|---|---|---|---|---|
| 2025 | -- | $443,145 | $43,010 | $400,135 |
| 2024 | $7,086 | $428,637 | $32,418 | $430,791 |
| 2023 | $8,374 | $480,382 | $32,418 | $447,964 |
| 2022 | $8,211 | $419,104 | $29,608 | $389,496 |
| 2021 | $6,757 | $322,041 | $29,608 | $292,433 |
| 2020 | $6,042 | $282,349 | $23,076 | $259,273 |
| 2019 | $6,204 | $283,716 | $23,076 | $260,640 |
| 2018 | $5,909 | $271,707 | $16,844 | $254,863 |
| 2017 | $5,856 | $274,303 | $16,844 | $257,459 |
| 2016 | $5,404 | $253,103 | $16,844 | $236,259 |
| 2015 | $7,345 | $253,677 | $16,844 | $236,833 |
| 2014 | $7,345 | $345,647 | $21,561 | $324,086 |
Source: Public Records
Map
Nearby Homes
- 2108 S Wall Ave
- 2110 Belmont Dr
- 2026 S Wall Ave
- 2319 Pollard Dr
- 1931 S Wiley Ave
- 1102 S Peach Ave S
- 515 & 517 Charnwood St
- 3922 & 3928 McDonald Rd
- 2521 Pounds Ave
- 2215 Homestead Ln
- 2315 Homestead Ln
- 2210 Homestead Ln
- 2431 Homestead Ln
- 2313 Dietz Ln
- 2413 Dietz Ln
- 2425 Dietz Ln
- 2322 Dietz Ln
- 904 E Dulse St
- 2410 Dietz Ln
- 317 Amberwood Cir
- 2304 2304 New Copeland Rd
- 2304 New Copeland Rd
- 2308 New Copeland Rd
- 2308 2308 New Copeland
- 2305 Bateman Ave
- 2311 Bateman Ave
- 2220 New Copeland Rd
- 2318 New Copeland Rd
- 2318 2318 New Copeland Rd
- 2321 Bateman Ave
- 2214 2214 New Copeland Rd
- 2214 New Copeland Rd
- 2217 Bateman Ave
- 2311 New Copeland Rd
- 2215 New Copeland Rd
- 2402 Copeland Rd
- 2402 2402 New Copeland Rd
- 2402 2402 New Copeland Rd Unit C
- 2402 New Copeland Rd
- 2402 New Copeland Rd Unit C