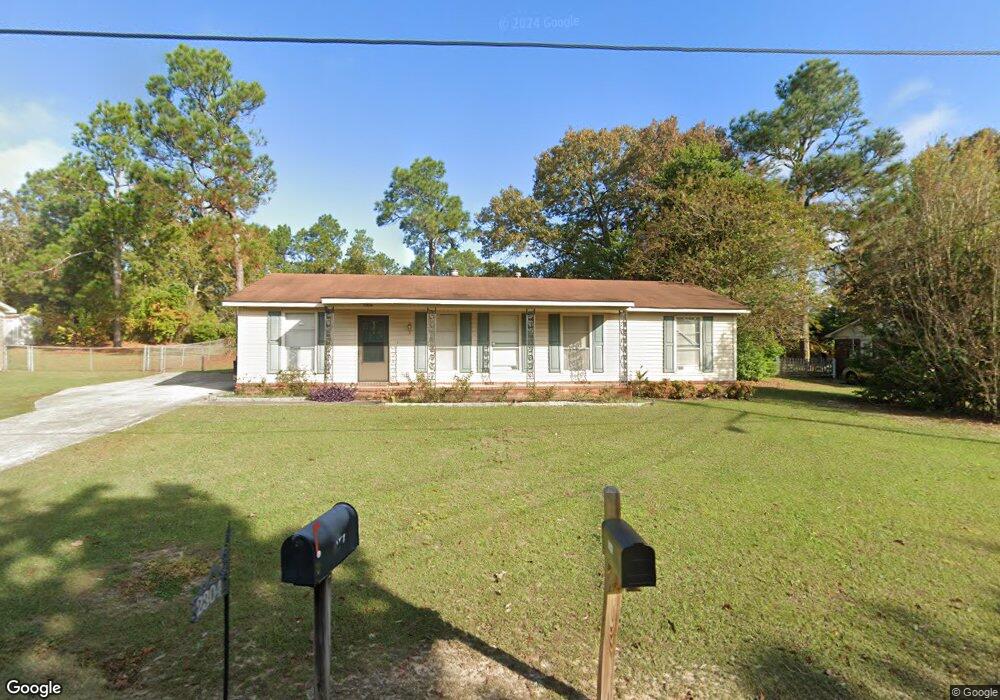
2304 Fieldcrest Rd Augusta, GA 30906
Richmond Factory NeighborhoodEstimated Value: $178,907 - $212,000
3
Beds
2
Baths
1,378
Sq Ft
$139/Sq Ft
Est. Value
About This Home
This home is located at 2304 Fieldcrest Rd, Augusta, GA 30906 and is currently estimated at $191,977, approximately $139 per square foot. 2304 Fieldcrest Rd is a home located in Richmond County with nearby schools including Hephzibah Middle School, Johnson Magnet, and Hephzibah High School.
Ownership History
Date
Name
Owned For
Owner Type
Purchase Details
Closed on
Aug 11, 2005
Sold by
S D A & Associates Inc
Bought by
Jones Betty
Current Estimated Value
Home Financials for this Owner
Home Financials are based on the most recent Mortgage that was taken out on this home.
Original Mortgage
$72,000
Outstanding Balance
$39,324
Interest Rate
6.69%
Mortgage Type
Fannie Mae Freddie Mac
Estimated Equity
$152,653
Purchase Details
Closed on
Feb 18, 2005
Sold by
Thompson Donna and Mcgrath Glen A
Bought by
S D A & Associates Inc
Purchase Details
Closed on
Aug 29, 2003
Sold by
R W Renovations Inc
Bought by
Thompson Donna and Mcgrath Glen A
Home Financials for this Owner
Home Financials are based on the most recent Mortgage that was taken out on this home.
Original Mortgage
$68,817
Interest Rate
6.13%
Mortgage Type
Purchase Money Mortgage
Purchase Details
Closed on
Jan 7, 2003
Sold by
Webb James R and Wells Fargo Home Mortgage Inc
Bought by
R W Renovations Inc
Purchase Details
Closed on
Jan 1, 1984
Purchase Details
Closed on
Oct 1, 1979
Create a Home Valuation Report for This Property
The Home Valuation Report is an in-depth analysis detailing your home's value as well as a comparison with similar homes in the area
Home Values in the Area
Average Home Value in this Area
Purchase History
| Date | Buyer | Sale Price | Title Company |
|---|---|---|---|
| Jones Betty | $90,000 | -- | |
| S D A & Associates Inc | -- | -- | |
| S D A & Associates Inc | -- | -- | |
| Thompson Donna | $69,900 | -- | |
| R W Renovations Inc | $39,600 | -- | |
| R W Renovations Inc | -- | -- | |
| -- | $38,700 | -- | |
| -- | $35,500 | -- |
Source: Public Records
Mortgage History
| Date | Status | Borrower | Loan Amount |
|---|---|---|---|
| Open | Jones Betty | $72,000 | |
| Closed | Jones Betty | $18,000 | |
| Previous Owner | Thompson Donna | $68,817 |
Source: Public Records
Tax History
| Year | Tax Paid | Tax Assessment Tax Assessment Total Assessment is a certain percentage of the fair market value that is determined by local assessors to be the total taxable value of land and additions on the property. | Land | Improvement |
|---|---|---|---|---|
| 2025 | $2,135 | $61,960 | $6,000 | $55,960 |
| 2024 | $2,135 | $57,088 | $6,000 | $51,088 |
| 2023 | $1,930 | $58,776 | $6,000 | $52,776 |
| 2022 | $1,449 | $37,611 | $6,000 | $31,611 |
| 2021 | $1,320 | $30,093 | $6,000 | $24,093 |
| 2020 | $1,303 | $30,093 | $6,000 | $24,093 |
| 2019 | $1,369 | $30,093 | $6,000 | $24,093 |
| 2018 | $1,377 | $30,093 | $6,000 | $24,093 |
| 2017 | $1,347 | $30,093 | $6,000 | $24,093 |
| 2016 | $1,348 | $30,093 | $6,000 | $24,093 |
| 2015 | $1,400 | $30,093 | $6,000 | $24,093 |
| 2014 | $1,357 | $30,093 | $6,000 | $24,093 |
Source: Public Records
Map
Nearby Homes
- 4211 Stone Rd
- 2224 Moncrieff St
- 2383 Richwood Dr
- 4304 Parkwood Dr
- 2264 Basswood Dr
- 4305 Parkwood Dr
- 2348 Fieldcrest Rd
- 2219 Travis Rd
- 4332 Parkwood Dr
- 2357 Basswood Dr
- 2264 Nellie Dr
- 2323 Woodsman Dr
- 2382 Patrick Ave
- 2317 Hiwatha Dr
- 4134 Daisy Ln
- 2409 Boykin Rd
- 2403 Travis Rd
- 2369a Plantation Rd
- 304 Suncrest Ct
- 308 Suncrest Ct
- 2302 Fieldcrest Rd
- 2306 Fieldcrest Rd
- 2240 Boykin Rd
- 2152 Fieldcrest Rd
- 2305 Fieldcrest Rd
- 2308 Fieldcrest Rd
- 2303 Fieldcrest Rd
- 2307 Fieldcrest Rd
- 2234 Boykin Rd
- 3809 Southfield Dr
- 2310 Fieldcrest Rd
- 2724 Boykin Rd
- 2304 Boykin Rd
- 2309 Fieldcrest Rd
- 2230 Boykin Rd
- 2312 Fieldcrest Rd
- 3811 Southfield Dr
- 3810 Southfield Dr
- 2305 Rockview Dr
- 2303 Rockview Dr
Your Personal Tour Guide
Ask me questions while you tour the home.