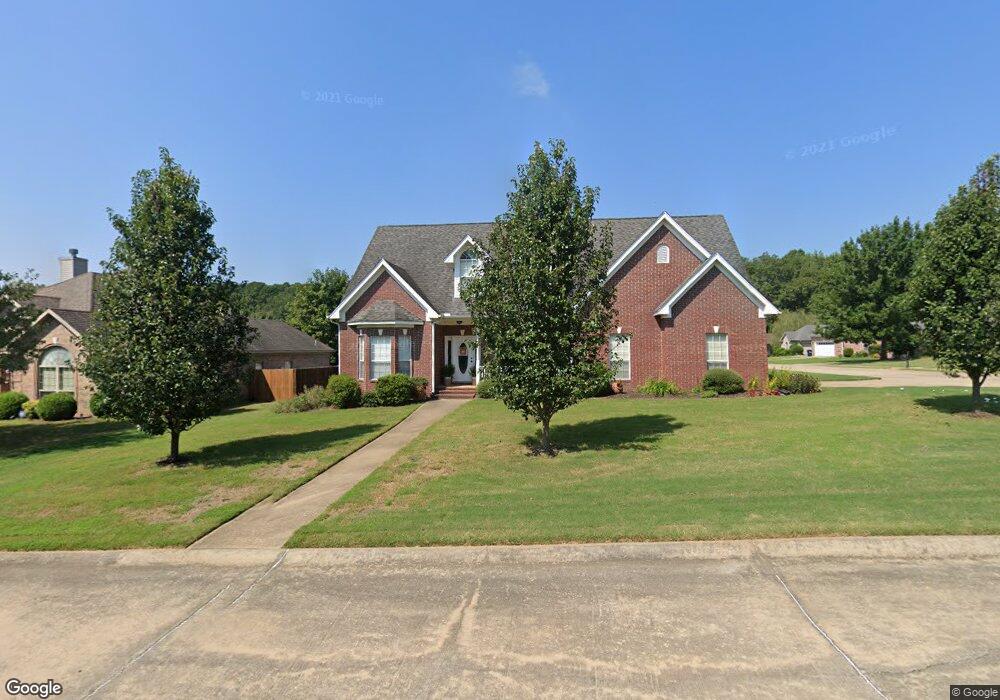
2305 Byron Dr Bryant, AR 72022
Estimated Value: $301,822 - $328,000
Studio
3
Baths
2,332
Sq Ft
$134/Sq Ft
Est. Value
About This Home
This home is located at 2305 Byron Dr, Bryant, AR 72022 and is currently estimated at $312,956, approximately $134 per square foot. 2305 Byron Dr is a home located in Saline County with nearby schools including Hill Farm Elementary School, Arkansas Christian Academy, and Woodland Hills Christian School.
Ownership History
Date
Name
Owned For
Owner Type
Purchase Details
Closed on
Aug 24, 2009
Sold by
Wald Christopher W and Baker Wald Tamara K
Bought by
Wald Christopher W and Wald Tamara K
Current Estimated Value
Purchase Details
Closed on
Dec 27, 2007
Sold by
Crane June and Crane Glyn
Bought by
Walkl Christopher W and Baker Tamera K
Home Financials for this Owner
Home Financials are based on the most recent Mortgage that was taken out on this home.
Original Mortgage
$178,386
Outstanding Balance
$111,561
Interest Rate
6.07%
Mortgage Type
VA
Estimated Equity
$201,395
Purchase Details
Closed on
Aug 10, 2005
Sold by
Crane June and Crane Glyn
Bought by
Crane June and Crane Glyn
Purchase Details
Closed on
Apr 29, 2005
Sold by
Graham Gary L and Graham Christy A
Bought by
Crane June and Crane Glyn
Home Financials for this Owner
Home Financials are based on the most recent Mortgage that was taken out on this home.
Original Mortgage
$135,200
Interest Rate
5.92%
Mortgage Type
New Conventional
Purchase Details
Closed on
Sep 26, 2000
Bought by
Graham
Create a Home Valuation Report for This Property
The Home Valuation Report is an in-depth analysis detailing your home's value as well as a comparison with similar homes in the area
Home Values in the Area
Average Home Value in this Area
Purchase History
| Date | Buyer | Sale Price | Title Company |
|---|---|---|---|
| Wald Christopher W | -- | -- | |
| Walkl Christopher W | $185,000 | None Available | |
| Crane June | -- | -- | |
| Crane June | $169,000 | -- | |
| Graham | $135,000 | -- | |
| Saline Bldrs | -- | -- |
Source: Public Records
Mortgage History
| Date | Status | Borrower | Loan Amount |
|---|---|---|---|
| Open | Walkl Christopher W | $178,386 | |
| Previous Owner | Crane June | $135,200 |
Source: Public Records
Tax History
| Year | Tax Paid | Tax Assessment Tax Assessment Total Assessment is a certain percentage of the fair market value that is determined by local assessors to be the total taxable value of land and additions on the property. | Land | Improvement |
|---|---|---|---|---|
| 2025 | $2,524 | $50,048 | $8,750 | $41,298 |
| 2024 | $2,302 | $50,048 | $8,750 | $41,298 |
| 2023 | $1,989 | $50,048 | $8,750 | $41,298 |
| 2022 | $1,873 | $50,048 | $8,750 | $41,298 |
| 2021 | $1,774 | $41,020 | $7,000 | $34,020 |
| 2020 | $1,774 | $41,020 | $7,000 | $34,020 |
| 2019 | $1,774 | $41,020 | $7,000 | $34,020 |
| 2018 | $1,799 | $41,020 | $7,000 | $34,020 |
| 2017 | $1,769 | $41,020 | $7,000 | $34,020 |
| 2016 | $1,879 | $38,510 | $7,000 | $31,510 |
| 2015 | $1,529 | $38,510 | $7,000 | $31,510 |
| 2014 | $1,529 | $38,510 | $7,000 | $31,510 |
Source: Public Records
Map
Nearby Homes
- 2713 Johnswood Village Dr
- 3107 Johnswood Village Dr
- 15618 Linden Dr
- 3458 Garden Club Dr
- 3113 Longmeadow Dr
- 3016 Olson Cir
- 1000 Shobe Rd
- 3104 Debra Gaye Dr
- 3393 Garden Club Dr
- 3105 Debra Gaye Dr
- 3413 N Cresent Dr
- 3322 Moss Creek Dr
- 3306 S Shobe Rd
- 6265 Saddle Hill Dr
- 6096 Saddle Hill Dr
- 2193 Fern Valley Dr
- 2500 Carywood Dr
- 5001 Woodstream Dr
- 5032 Woodstream Dr
- 15315 Birch Dr
- 2302 Byron Dr
- 2223 Byron Dr
- 2310 Byron Dr
- 2316 Byron Dr
- 2417 Defoe Cir
- 2306 Defoe Cir
- 2222 Byron Dr
- 2217 Byron Dr
- 2217 Byron Dr
- 2411 Defoe Cir
- 2224 Defoe Cir
- 2216 Byron Dr
- 2403 Defoe Cir
- 2218 Defoe Cir
- 2322 Byron Dr
- 2701 Johnswood Village Dr
- 2211 Byron Dr
- 2619 Johnswood Village Dr
- 2210 Byron Dr
- 2212 Defoe Cir
Your Personal Tour Guide
Ask me questions while you tour the home.