
Seller's Agent in 2021
Monte Young
Bellwether Real Estate
(360) 380-0803
2 in this area
53 Total Sales

Estimated Value: $575,000 - $722,000
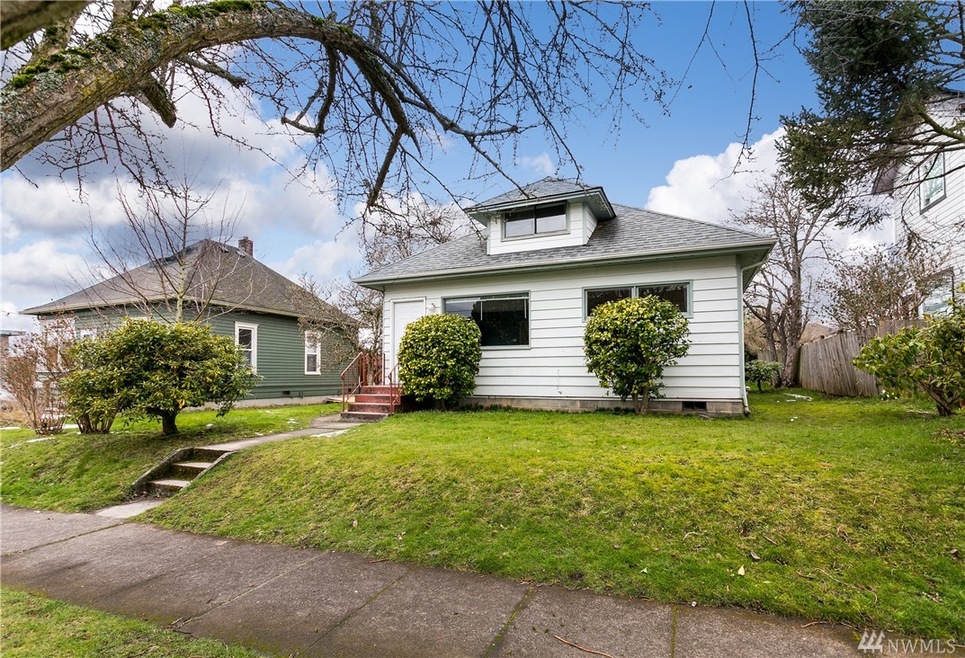
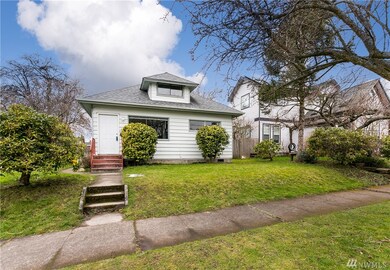
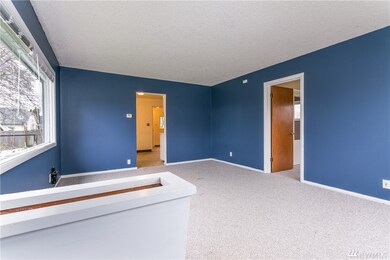
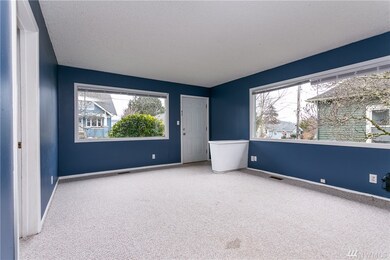
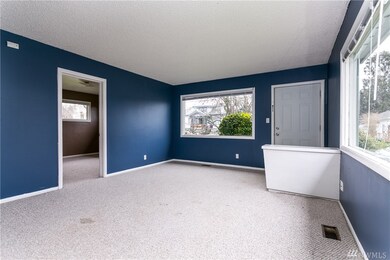
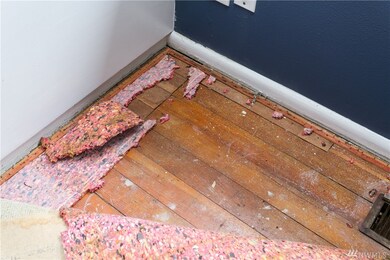
Location, location, location! This 2 bedroom/1 bath house is located in the heart of the Lettered Streets. Walkable to what downtown Bellingham has to offer, this home has so much potential! Large living area, master bedroom and flex space upstairs. Put some TLC into this home and bring the charm back to life. Great opportunity to own in the Lettered Streets! Home was being previously rented for $1,695/month.
Last Agent to Sell the Property
Bellwether Real Estate License #2871 Listed on: 02/18/2021
Source: Northwest Multiple Listing Service (NWMLS)
MLS#: NWM1726409
| Date | Buyer | Sale Price | Title Company |
|---|---|---|---|
| Otoole Jennifer K | $460,000 | Whatcom Land Title | |
| Parker Marcia E | -- | None Available |
| Date | Status | Borrower | Loan Amount |
|---|---|---|---|
| Open | Otoole Jennifer K | $437,000 |
| Date | Event | Price | List to Sale | Price per Sq Ft |
|---|---|---|---|---|
| 03/26/2021 03/26/21 | Sold | $460,000 | +3.4% | $390 / Sq Ft |
| 02/22/2021 02/22/21 | Pending | -- | -- | -- |
| 02/18/2021 02/18/21 | For Sale | $445,000 | -- | $377 / Sq Ft |
| Year | Tax Paid | Tax Assessment Tax Assessment Total Assessment is a certain percentage of the fair market value that is determined by local assessors to be the total taxable value of land and additions on the property. | Land | Improvement |
|---|---|---|---|---|
| 2024 | $4,430 | $555,041 | $277,092 | $277,949 |
| 2023 | $4,430 | $569,139 | $284,130 | $285,009 |
| 2022 | $3,528 | $490,646 | $244,944 | $245,702 |
| 2021 | $3,461 | $379,800 | $194,400 | $185,400 |
| 2020 | $3,070 | $351,667 | $180,000 | $171,667 |
| 2019 | $2,748 | $301,477 | $141,415 | $160,062 |
| 2018 | $2,768 | $270,625 | $126,965 | $143,660 |
| 2017 | $2,386 | $232,999 | $109,310 | $123,689 |
| 2016 | $2,088 | $209,911 | $98,090 | $111,821 |
| 2015 | $2,048 | $191,281 | $89,590 | $101,691 |
| 2014 | -- | $181,481 | $85,000 | $96,481 |
| 2013 | -- | $180,896 | $73,500 | $107,396 |
Seller's Agent in 2021
Monte Young
Bellwether Real Estate
(360) 380-0803
2 in this area
53 Total Sales
L
Buyer's Agent in 2021
Lin Nelson
HomeSmart One Realty
(360) 961-0408
1 in this area
10 Total Sales
Source: Northwest Multiple Listing Service (NWMLS)
MLS Number: NWM1726409
APN: 380319-108068-0000
Disclaimer: Certain information contained herein is derived from information provided by parties other than Homes.com. All information provided is deemed reliable, but is not guaranteed to be accurate and should be independently verified.
![]() All data is obtained from various sources and may not have been verified by broker or MLS GRID. Supplied Open House Information is subject to change without notice. All information should be independently reviewed and verified for accuracy. Properties may or may not be listed by the office/agent presenting the information. Listing information is provided by the Northwest Multiple Listing Service (NWMLS). Property information is based on available data that may include MLS information, county records, and other sources. Listings marked with the 3 tree icon and provided by NWMLS. All properties are subject to prior sale or withdrawal. IDX information is provided exclusively for consumers’ personal noncommercial use, that it may not be used for any purpose other than to identify prospective properties consumers may be interested in purchasing, that the data is deemed reliable but is not guaranteed by MLS GRID. ©2025 NWMLS.
All data is obtained from various sources and may not have been verified by broker or MLS GRID. Supplied Open House Information is subject to change without notice. All information should be independently reviewed and verified for accuracy. Properties may or may not be listed by the office/agent presenting the information. Listing information is provided by the Northwest Multiple Listing Service (NWMLS). Property information is based on available data that may include MLS information, county records, and other sources. Listings marked with the 3 tree icon and provided by NWMLS. All properties are subject to prior sale or withdrawal. IDX information is provided exclusively for consumers’ personal noncommercial use, that it may not be used for any purpose other than to identify prospective properties consumers may be interested in purchasing, that the data is deemed reliable but is not guaranteed by MLS GRID. ©2025 NWMLS.
Based on information submitted to the MLS GRID