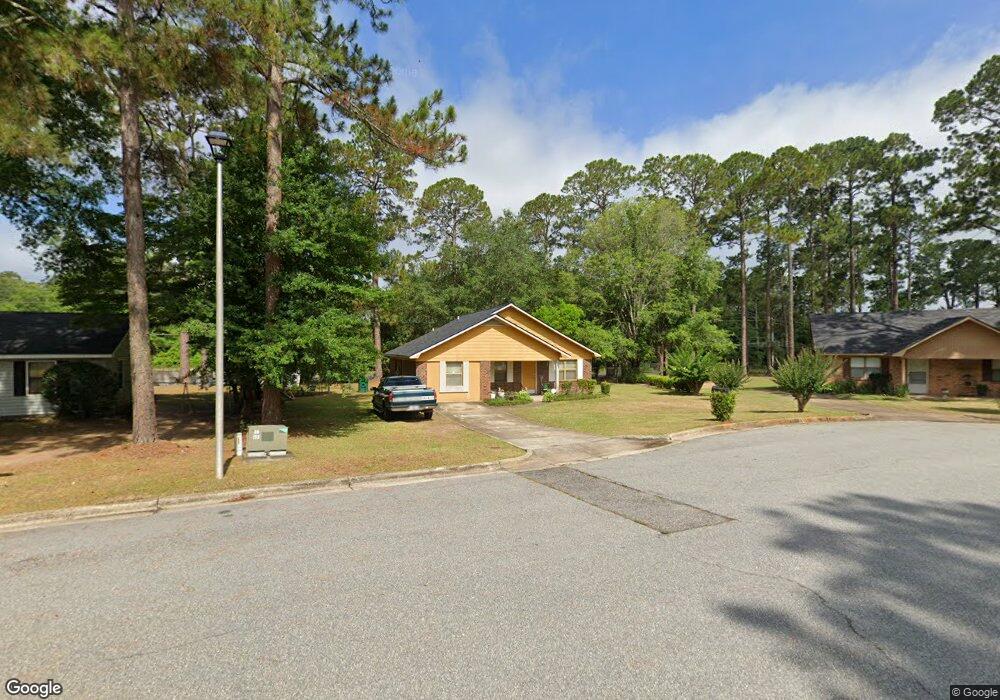
2305 Pebble Beach Ct Albany, GA 31707
Estimated Value: $106,000 - $170,000
3
Beds
2
Baths
1,265
Sq Ft
$106/Sq Ft
Est. Value
About This Home
This home is located at 2305 Pebble Beach Ct, Albany, GA 31707 and is currently estimated at $134,012, approximately $105 per square foot. 2305 Pebble Beach Ct is a home located in Dougherty County with nearby schools including West Town Elementary School, Southside Middle School, and Monroe High School.
Ownership History
Date
Name
Owned For
Owner Type
Purchase Details
Closed on
Sep 28, 2006
Sold by
Mipat Properties Llc
Bought by
Carroll Naomi G
Current Estimated Value
Home Financials for this Owner
Home Financials are based on the most recent Mortgage that was taken out on this home.
Original Mortgage
$51,753
Interest Rate
6.06%
Mortgage Type
FHA
Purchase Details
Closed on
Aug 28, 2003
Sold by
Stubbs Ezell T and Stubbs Valerie W
Bought by
Mipat Properties Llc
Purchase Details
Closed on
Jun 30, 1992
Sold by
Hud
Bought by
Stubbs Ezell T and V W
Purchase Details
Closed on
Sep 4, 1990
Sold by
Bancboston Mtge Corp
Bought by
Housing & Urban Dev
Purchase Details
Closed on
Sep 1, 1990
Sold by
Hayward Eugene
Bought by
Bancboston Mtge Corp
Purchase Details
Closed on
Jul 11, 1984
Sold by
Pace Earl K
Bought by
Hayward Eugene
Create a Home Valuation Report for This Property
The Home Valuation Report is an in-depth analysis detailing your home's value as well as a comparison with similar homes in the area
Home Values in the Area
Average Home Value in this Area
Purchase History
| Date | Buyer | Sale Price | Title Company |
|---|---|---|---|
| Carroll Naomi G | $52,163 | -- | |
| Mipat Properties Llc | $46,000 | -- | |
| Stubbs Ezell T | $31,500 | -- | |
| Housing & Urban Dev | -- | -- | |
| Bancboston Mtge Corp | $4,600 | -- | |
| Hayward Eugene | -- | -- |
Source: Public Records
Mortgage History
| Date | Status | Borrower | Loan Amount |
|---|---|---|---|
| Closed | Carroll Naomi G | $51,753 |
Source: Public Records
Tax History Compared to Growth
Tax History
| Year | Tax Paid | Tax Assessment Tax Assessment Total Assessment is a certain percentage of the fair market value that is determined by local assessors to be the total taxable value of land and additions on the property. | Land | Improvement |
|---|---|---|---|---|
| 2024 | $1,313 | $27,520 | $5,600 | $21,920 |
| 2023 | $1,282 | $27,520 | $5,600 | $21,920 |
| 2022 | $1,287 | $27,520 | $5,600 | $21,920 |
| 2021 | $1,193 | $27,520 | $5,600 | $21,920 |
| 2020 | $1,196 | $27,520 | $5,600 | $21,920 |
| 2019 | $1,200 | $27,520 | $5,600 | $21,920 |
| 2018 | $1,206 | $27,520 | $5,600 | $21,920 |
| 2017 | $1,123 | $27,520 | $5,600 | $21,920 |
| 2016 | $1,124 | $27,520 | $5,600 | $21,920 |
| 2015 | $1,127 | $27,520 | $5,600 | $21,920 |
| 2014 | $1,048 | $25,920 | $4,000 | $21,920 |
Source: Public Records
Map
Nearby Homes
- 2303 Joel Dr
- 1029 Davidson Dr
- 1825 W Oakridge Dr
- 1104 University St
- 2102 Techwood Dr
- 1003 University St
- 2013 Jones Ave
- 501 Endicott Ln
- 410 Endicott Ln
- 802 Colquitt Cir
- 2101 Goldendale Ln
- 1911 Gillespie Ave
- 1804 W Lincoln Ave
- 1906 W Whitney Ave
- 1714 W Lincoln Ave
- 2307 Evergreen Dr
- 1806 W Whitney Ave
- 1804 W Whitney Ave
- 1610 W Gordon Ave
- 1513 Colquitt Ave
- 2303 Pebble Beach Ct
- 2307 Pebble Beach Ct
- 2301 Pebble Beach Ct
- 2306 Pebble Beach Ct
- 1201 Firestone Dr
- 2302 Pebble Beach Ct
- 2304 Pebble Beach Ct
- 2305 Alameda Ln
- 1205 Firestone Dr
- 1204 Citrus Ct
- 2303 Alameda Ln
- 2306 Alameda Ln
- 1207 Firestone Dr
- 909 Willie Pitts Jr Rd
- 1202 Citrus Ct
- 2304 Alameda Ln
- 1200 Firestone Dr
- 1202 Firestone Dr
- 2302 Alameda Ln
- 1205 Citrus Ct