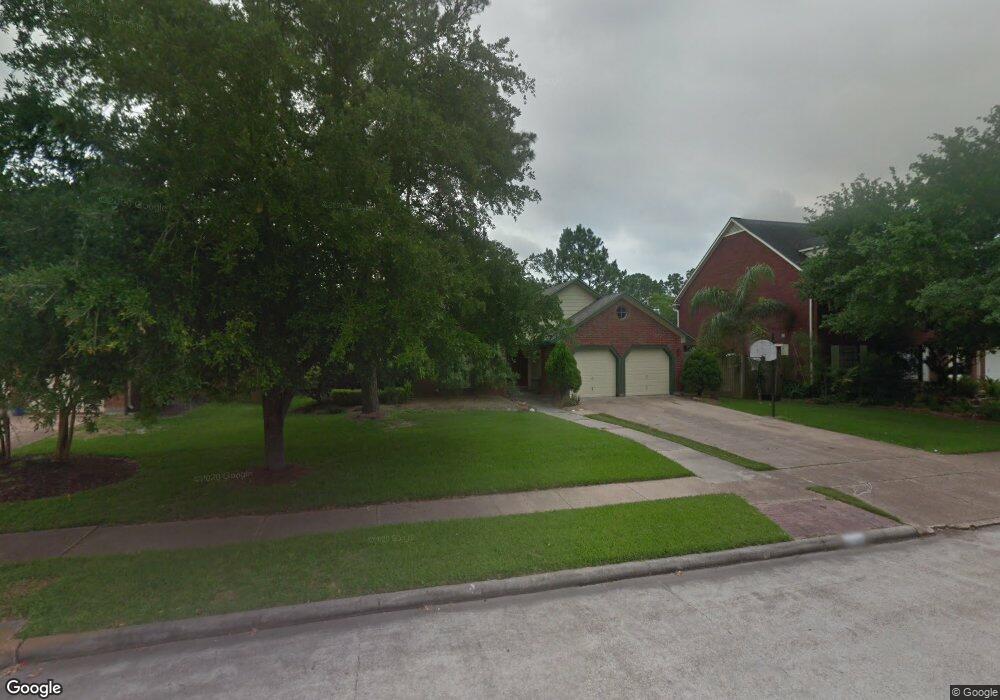
2305 S Mission Cir Friendswood, TX 77546
Estimated Value: $353,000 - $378,000
3
Beds
2
Baths
2,399
Sq Ft
$152/Sq Ft
Est. Value
About This Home
This home is located at 2305 S Mission Cir, Friendswood, TX 77546 and is currently estimated at $365,794, approximately $152 per square foot. 2305 S Mission Cir is a home located in Galveston County with nearby schools including C.W. Cline Elementary School, Windsong Elementary School, and Friendswood Junior High School.
Ownership History
Date
Name
Owned For
Owner Type
Purchase Details
Closed on
Feb 20, 2024
Sold by
Domanio Real Estate Llc
Bought by
Denhartog Mike and Denhartog Lynsie
Current Estimated Value
Home Financials for this Owner
Home Financials are based on the most recent Mortgage that was taken out on this home.
Original Mortgage
$272,000
Outstanding Balance
$267,184
Interest Rate
6.6%
Mortgage Type
New Conventional
Estimated Equity
$98,610
Purchase Details
Closed on
Mar 26, 2015
Sold by
Forester Janice K and Forester Janice Stafford
Bought by
Calvillo Enrique Valenzuela
Purchase Details
Closed on
Oct 28, 1998
Sold by
Klein Jeffrey J
Bought by
Forester Harry A and Forester Janice K
Home Financials for this Owner
Home Financials are based on the most recent Mortgage that was taken out on this home.
Original Mortgage
$107,500
Interest Rate
6.57%
Create a Home Valuation Report for This Property
The Home Valuation Report is an in-depth analysis detailing your home's value as well as a comparison with similar homes in the area
Home Values in the Area
Average Home Value in this Area
Purchase History
| Date | Buyer | Sale Price | Title Company |
|---|---|---|---|
| Denhartog Mike | -- | Chicago Title | |
| Calvillo Enrique Valenzuela | -- | First American Title | |
| Forester Harry A | -- | American Title Co |
Source: Public Records
Mortgage History
| Date | Status | Borrower | Loan Amount |
|---|---|---|---|
| Open | Denhartog Mike | $272,000 | |
| Previous Owner | Forester Harry A | $107,500 |
Source: Public Records
Tax History Compared to Growth
Tax History
| Year | Tax Paid | Tax Assessment Tax Assessment Total Assessment is a certain percentage of the fair market value that is determined by local assessors to be the total taxable value of land and additions on the property. | Land | Improvement |
|---|---|---|---|---|
| 2025 | $8,391 | $422,680 | $28,710 | $393,970 |
| 2024 | $8,391 | $419,630 | $28,710 | $390,920 |
| 2023 | $8,391 | $406,300 | $28,710 | $377,590 |
| 2022 | $7,884 | $357,930 | $28,710 | $329,220 |
| 2021 | $6,694 | $286,590 | $28,710 | $257,880 |
| 2020 | $6,229 | $258,560 | $28,710 | $229,850 |
| 2019 | $5,356 | $210,910 | $28,710 | $182,200 |
| 2018 | $5,496 | $215,170 | $28,710 | $186,460 |
| 2017 | $5,643 | $217,270 | $28,710 | $188,560 |
| 2016 | $5,275 | $203,120 | $28,710 | $174,410 |
| 2015 | $2,178 | $191,810 | $28,710 | $163,100 |
| 2014 | $1,946 | $165,410 | $28,710 | $136,700 |
Source: Public Records
Map
Nearby Homes
- 2211 S Mission Cir
- 1804 San Jose St
- 2605 S Mission Cir
- 2117 San Miguel Dr
- 1910 N Mission Cir
- 2411 Lakeway Dr
- 99 El Dorado Dr
- 2314 Leslies Ct
- 40 Windsong Ln
- 2512 Ravenna Ct
- 1804 Anna Way
- 1718 Avery Ln
- 601 E Castle Harbour Dr
- 1913 Lundy Ln
- 1536 River Point Dr
- 644 E Castle Harbour Dr
- 111 Dunbar Unit 501
- 110 Dorado Dr
- 2829 Fairway Dr
- 1905 Schulte Ln
- 2305 S Mission Cir
- 2305 S Mission Cir
- 2307 S Mission Cir
- 2303 S Mission Cir
- 2309 S Mission Cir
- 2301 S Mission Cir
- 1908 Palo Duro St
- 1907 Palo Duro St
- 2311 S Mission Cir
- 1905 Presidio St
- 1910 San Joaquin Pkwy
- 1906 Palo Duro St
- 1905 Palo Duro St
- 1908 San Joaquin Pkwy
- 1903 Presidio St
- 2401 S Mission Cir
- 1904 Palo Duro St
- 2002 San Joaquin Pkwy
- 1906 San Joaquin Pkwy
- 1903 Palo Duro St