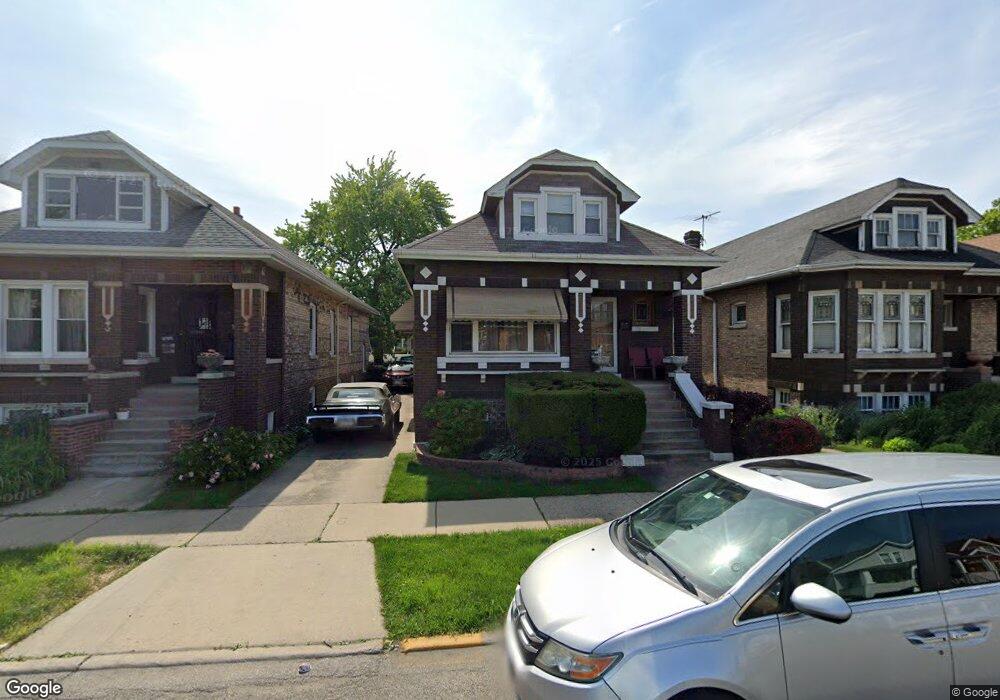
2306 Ridgeland Ave Berwyn, IL 60402
Estimated Value: $319,000 - $380,000
3
Beds
2
Baths
1,388
Sq Ft
$243/Sq Ft
Est. Value
About This Home
This home is located at 2306 Ridgeland Ave, Berwyn, IL 60402 and is currently estimated at $337,744, approximately $243 per square foot. 2306 Ridgeland Ave is a home located in Cook County with nearby schools including Hiawatha Elementary School, Freedom Middle School, and J Sterling Morton West High School.
Ownership History
Date
Name
Owned For
Owner Type
Purchase Details
Closed on
Mar 23, 2006
Sold by
Botello Rosendo
Bought by
Thomas Ronald G
Current Estimated Value
Home Financials for this Owner
Home Financials are based on the most recent Mortgage that was taken out on this home.
Original Mortgage
$236,800
Outstanding Balance
$204,792
Interest Rate
9%
Mortgage Type
Fannie Mae Freddie Mac
Estimated Equity
$132,952
Purchase Details
Closed on
Sep 30, 2003
Sold by
Botello Ofelia
Bought by
Botello Rosendo
Home Financials for this Owner
Home Financials are based on the most recent Mortgage that was taken out on this home.
Original Mortgage
$138,700
Interest Rate
6.49%
Mortgage Type
Unknown
Purchase Details
Closed on
Jan 31, 2000
Sold by
Arrequin Ramon and Gutierrez Maria
Bought by
Botello Rosendo and Botello Ofelia
Home Financials for this Owner
Home Financials are based on the most recent Mortgage that was taken out on this home.
Original Mortgage
$131,084
Interest Rate
7.98%
Mortgage Type
FHA
Create a Home Valuation Report for This Property
The Home Valuation Report is an in-depth analysis detailing your home's value as well as a comparison with similar homes in the area
Home Values in the Area
Average Home Value in this Area
Purchase History
| Date | Buyer | Sale Price | Title Company |
|---|---|---|---|
| Thomas Ronald G | $296,000 | Multiple | |
| Botello Rosendo | -- | -- | |
| Botello Rosendo | $132,000 | 1St American Title |
Source: Public Records
Mortgage History
| Date | Status | Borrower | Loan Amount |
|---|---|---|---|
| Open | Thomas Ronald G | $236,800 | |
| Previous Owner | Botello Rosendo | $138,700 | |
| Previous Owner | Botello Rosendo | $131,084 |
Source: Public Records
Tax History Compared to Growth
Tax History
| Year | Tax Paid | Tax Assessment Tax Assessment Total Assessment is a certain percentage of the fair market value that is determined by local assessors to be the total taxable value of land and additions on the property. | Land | Improvement |
|---|---|---|---|---|
| 2024 | $8,109 | $24,612 | $5,402 | $19,210 |
| 2023 | $6,156 | $26,000 | $5,402 | $20,598 |
| 2022 | $6,156 | $16,969 | $4,741 | $12,228 |
| 2021 | $6,012 | $16,968 | $4,740 | $12,228 |
| 2020 | $5,777 | $16,968 | $4,740 | $12,228 |
| 2019 | $5,040 | $14,612 | $4,299 | $10,313 |
| 2018 | $4,742 | $14,612 | $4,299 | $10,313 |
| 2017 | $4,879 | $14,612 | $4,299 | $10,313 |
| 2016 | $3,800 | $11,259 | $3,528 | $7,731 |
| 2015 | $5,127 | $14,683 | $3,528 | $11,155 |
| 2014 | $4,967 | $14,683 | $3,528 | $11,155 |
| 2013 | $3,971 | $13,522 | $3,528 | $9,994 |
Source: Public Records
Map
Nearby Homes
- 2343 Ridgeland Ave
- 2310 Gunderson Ave
- 2215 Cuyler Ave
- 2302 Scoville Ave
- 2327 Harvey Ave
- 2235 Harvey Ave
- 2445 Highland Ave
- 2127 Highland Ave
- 6401 W 23rd St Unit 5
- 2114 Highland Ave
- 2223 S Lombard Ave
- 2102 Gunderson Ave
- 1938 Highland Ave
- 2419 S Lombard Ave
- 2107 East Ave
- 2550 Cuyler Ave
- 6117 W Cermak Rd
- 2442 Clarence Ave
- 1935 Harvey Ave
- 1307 S Harvey Ave
- 2304 Ridgeland Ave
- 2310 Ridgeland Ave
- 2302 Ridgeland Ave
- 2312 Ridgeland Ave
- 2300 Ridgeland Ave
- 2314 Ridgeland Ave
- 2309 Elmwood Ave
- 2311 Elmwood Ave
- 2307 Elmwood Ave
- 2315 Elmwood Ave
- 2316 Ridgeland Ave
- 2319 Elmwood Ave
- 2301 Elmwood Ave
- 2313 Ridgeland Ave
- 2309 Ridgeland Ave
- 2307 Ridgeland Ave
- 2311 Ridgeland Ave
- 2305 Ridgeland Ave
- 2323 Elmwood Ave
- 2303 Ridgeland Ave