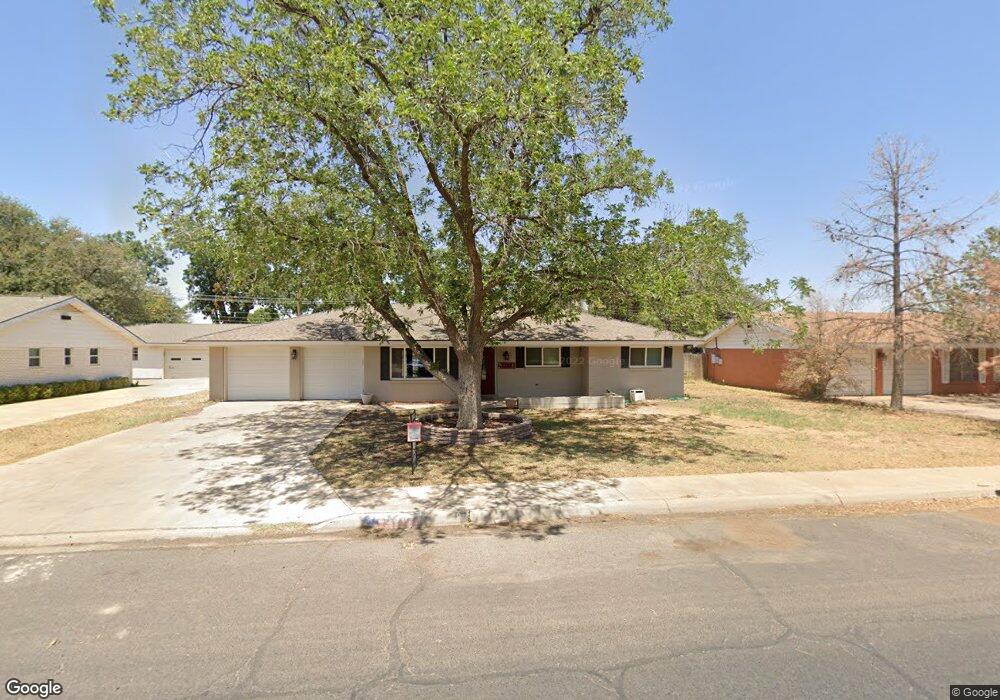
2306 W Shandon Ave Midland, TX 79705
Fannin Terrace NeighborhoodEstimated Value: $291,940 - $316,000
4
Beds
2
Baths
1,774
Sq Ft
$171/Sq Ft
Est. Value
About This Home
This home is located at 2306 W Shandon Ave, Midland, TX 79705 and is currently estimated at $302,985, approximately $170 per square foot. 2306 W Shandon Ave is a home located in Midland County with nearby schools including Fannin Elementary School, Midland High School, and Robert H. Goddard Junior High School.
Ownership History
Date
Name
Owned For
Owner Type
Purchase Details
Closed on
Aug 24, 2022
Sold by
Renton Neil A and Renton Tracy L
Bought by
612 Investors Llc
Current Estimated Value
Purchase Details
Closed on
May 25, 2005
Sold by
Smith Kenneth W and Smith Melissa M
Bought by
Renton Neil A and Renton Tracy L
Home Financials for this Owner
Home Financials are based on the most recent Mortgage that was taken out on this home.
Original Mortgage
$88,104
Interest Rate
5.87%
Mortgage Type
FHA
Purchase Details
Closed on
Apr 30, 1999
Sold by
Rose Edward P
Bought by
Renton Neil A
Purchase Details
Closed on
Mar 31, 1997
Bought by
Renton Neil A
Purchase Details
Closed on
Dec 1, 1996
Bought by
Renton Neil A
Purchase Details
Closed on
Dec 27, 1963
Bought by
Renton Neil A
Create a Home Valuation Report for This Property
The Home Valuation Report is an in-depth analysis detailing your home's value as well as a comparison with similar homes in the area
Home Values in the Area
Average Home Value in this Area
Purchase History
| Date | Buyer | Sale Price | Title Company |
|---|---|---|---|
| 612 Investors Llc | -- | -- | |
| Renton Neil A | -- | None Available | |
| Renton Neil A | -- | -- | |
| Renton Neil A | -- | -- | |
| Renton Neil A | -- | -- | |
| Renton Neil A | -- | -- |
Source: Public Records
Mortgage History
| Date | Status | Borrower | Loan Amount |
|---|---|---|---|
| Previous Owner | Renton Neil A | $88,104 |
Source: Public Records
Tax History Compared to Growth
Tax History
| Year | Tax Paid | Tax Assessment Tax Assessment Total Assessment is a certain percentage of the fair market value that is determined by local assessors to be the total taxable value of land and additions on the property. | Land | Improvement |
|---|---|---|---|---|
| 2025 | $3,842 | $246,900 | $22,510 | $224,390 |
| 2024 | $3,847 | $253,320 | $22,510 | $230,810 |
| 2023 | $3,718 | $248,110 | $22,510 | $225,600 |
| 2022 | $3,299 | $211,170 | $22,510 | $188,660 |
| 2021 | $4,099 | $235,310 | $22,510 | $212,800 |
| 2020 | $3,295 | $222,030 | $22,510 | $199,520 |
| 2019 | $4,203 | $222,030 | $22,510 | $199,520 |
| 2018 | $4,002 | $205,830 | $22,510 | $183,320 |
| 2017 | $3,827 | $196,820 | $22,510 | $174,310 |
| 2016 | $3,576 | $183,570 | $22,510 | $161,060 |
| 2015 | -- | $183,570 | $22,510 | $161,060 |
| 2014 | -- | $173,030 | $22,510 | $150,520 |
Source: Public Records
Map
Nearby Homes
- 2400 W Dengar Ave
- 2205 Cimmaron Ave
- 2207 Raleigh Point Dr
- 19 Winchester Ct
- 2406 Dartmouth Dr
- 2609 Mcclintic St
- 2603 Hodges St
- 2601 W Dengar Ave
- 2704 N L St
- 63 Ironwood Ct Unit 91
- 63 Ironwood Ct
- 2605 Inwood Ct
- 2505 Maxwell Dr
- 2409 Stutz Place
- 2406 Stutz Place
- 2000 Neely Ave
- 5 Chatham Ct
- 2305 Auburn Place
- 2800 Cimmaron Ave
- 1611 W Pecan Ave
- 2308 W Shandon Ave
- 2304 W Shandon Ave
- 2307 Camarie Ave
- 2309 Camarie Ave
- 2305 Camarie Ave
- 2302 W Shandon Ave
- 2307 W Shandon Ave
- 2305 W Shandon Ave
- 2309 W Shandon Ave
- 2311 Camarie Ave
- 2303 Camarie Ave
- 2303 W Shandon Ave
- 2311 W Shandon Ave
- 2312 W Shandon Ave
- 2300 W Shandon Ave
- 3102 Mogford St
- 2301 Camarie Ave
- 2306 W Dengar Ave
- 2306 Camarie Ave
- 2313 W Shandon Ave