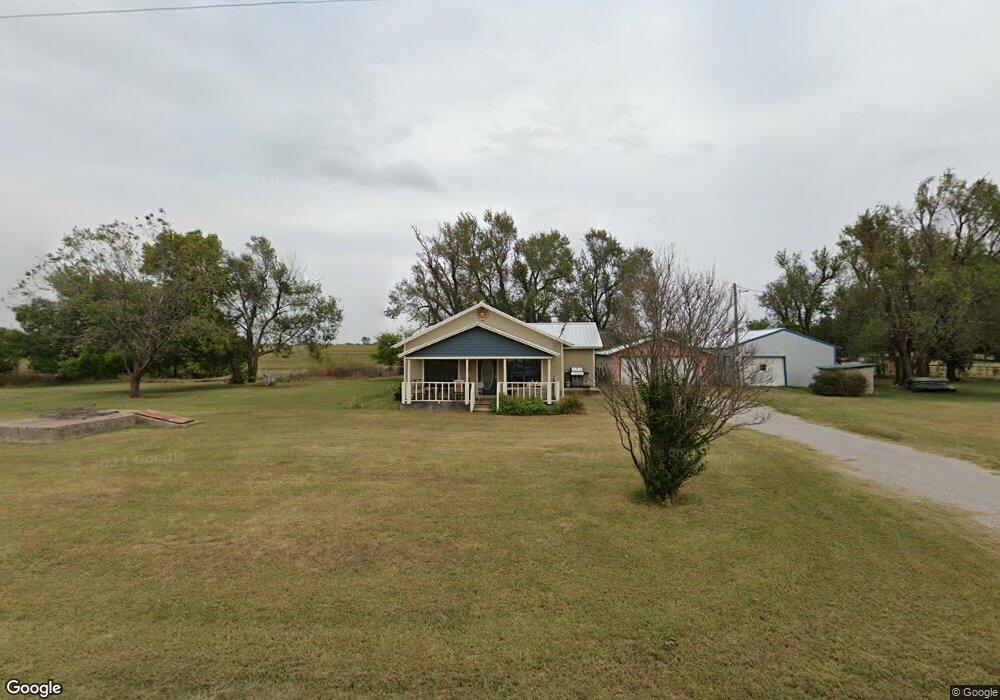
2306 Whaley Marlow, OK 73055
Estimated Value: $138,000 - $206,000
3
Beds
2
Baths
1,421
Sq Ft
$117/Sq Ft
Est. Value
About This Home
This home is located at 2306 Whaley, Marlow, OK 73055 and is currently estimated at $165,554, approximately $116 per square foot. 2306 Whaley is a home located in Stephens County with nearby schools including Marlow Elementary School, Marlow Middle School, and Marlow High School.
Ownership History
Date
Name
Owned For
Owner Type
Purchase Details
Closed on
Mar 21, 2013
Sold by
First National Bank In Marlow
Bought by
Hinkel Jack R
Current Estimated Value
Home Financials for this Owner
Home Financials are based on the most recent Mortgage that was taken out on this home.
Original Mortgage
$66,544
Interest Rate
3.59%
Mortgage Type
Unknown
Purchase Details
Closed on
Sep 20, 2011
Sold by
Suson Lindsey Leon and Suson Crstal Ann
Bought by
First National Bank In Marlow
Purchase Details
Closed on
Oct 30, 2006
Sold by
Mccarter Clint
Bought by
Suson Lindsey Leon and Suson Crystal Ann
Home Financials for this Owner
Home Financials are based on the most recent Mortgage that was taken out on this home.
Original Mortgage
$61,171
Interest Rate
6.37%
Mortgage Type
Unknown
Purchase Details
Closed on
Jun 26, 2002
Sold by
Alexander Ruben T and Alexander Arcy
Create a Home Valuation Report for This Property
The Home Valuation Report is an in-depth analysis detailing your home's value as well as a comparison with similar homes in the area
Purchase History
| Date | Buyer | Sale Price | Title Company |
|---|---|---|---|
| Hinkel Jack R | $70,000 | None Available | |
| First National Bank In Marlow | -- | None Available | |
| Suson Lindsey Leon | $65,000 | None Available | |
| -- | $55,000 | -- |
Source: Public Records
Mortgage History
| Date | Status | Borrower | Loan Amount |
|---|---|---|---|
| Closed | Hinkel Jack R | $66,544 | |
| Previous Owner | Suson Lindsey Leon | $61,171 |
Source: Public Records
Tax History
| Year | Tax Paid | Tax Assessment Tax Assessment Total Assessment is a certain percentage of the fair market value that is determined by local assessors to be the total taxable value of land and additions on the property. | Land | Improvement |
|---|---|---|---|---|
| 2025 | $1,223 | $12,165 | $790 | $11,375 |
| 2024 | $878 | $8,584 | $719 | $7,865 |
| 2023 | $878 | $8,585 | $723 | $7,862 |
| 2022 | $798 | $8,176 | $705 | $7,471 |
| 2021 | $702 | $7,786 | $672 | $7,114 |
| 2020 | $660 | $7,062 | $672 | $6,390 |
| 2019 | $627 | $6,743 | $672 | $6,071 |
| 2018 | $592 | $6,422 | $672 | $5,750 |
| 2017 | $615 | $6,679 | $672 | $6,007 |
| 2016 | $688 | $7,480 | $672 | $6,808 |
| 2015 | $418 | $7,480 | $672 | $6,808 |
| 2014 | $418 | $7,480 | $672 | $6,808 |
Source: Public Records
Map
Nearby Homes
- 6424 N Shore Rd
- 4 lots Corner Pine & Young
- L12 Creekside Dr
- L16 Creekside Dr
- L17 Creekside Dr
- L13 Creekside Dr
- 3511 Highway 29
- 3105 S Plainsman Rd
- 3706 E Camelback Rd
- 6424 N Shore
- 0 E 1630 Rd
- 2510 N Cason Rd
- 1816 S Railroad St
- 416 E Cheyenne St
- 503, 505, 507 E Main St
- 603 E Apache St
- 1007 S Broadway St
- 511 S Broadway St
- 106 W Cheyenne Ave
- 605 N Ash St
- 2202 S Whaley Rd
- 2102 S Whaley Rd
- 295631 E 1680 Rd
- 3301 Renfrow
- 6924 N Whitetail Dr
- 2771 S Whaley Rd
- 1827 S Whaley Rd
- 3076 Rocking Horse Ranch
- 199H Rr 6
- 3101 E York Rd
- 1704 Whaley
- 1704 S Whaley Rd
- 2909 S Whaley Rd
- 4180 E Camelback Rd
- 4571 Cs 2750
- 4673 Cr 2750
- RT 1 Box 59a
- HC 64 Box 19 B
- 3010 Whippoorwill Ln
- Rt. 2 Box 196d
Your Personal Tour Guide
Ask me questions while you tour the home.