Estimated Value: $263,000 - $328,000
3
Beds
2
Baths
1,491
Sq Ft
$198/Sq Ft
Est. Value
About This Home
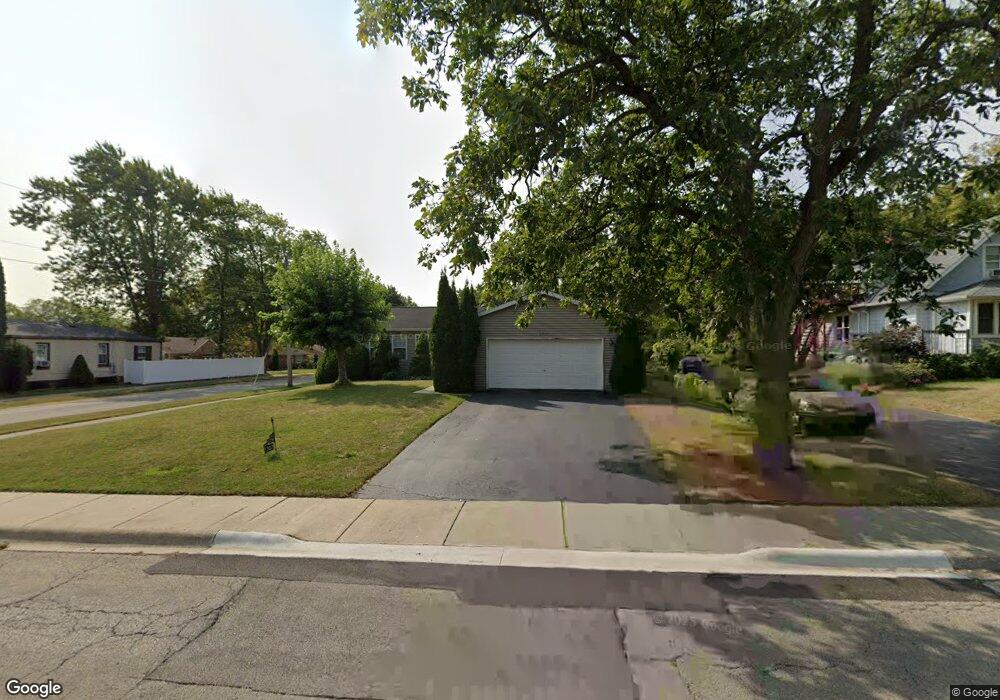
This home is located at 2307 33rd St, Zion, IL 60099 and is currently estimated at $295,134, approximately $197 per square foot. 2307 33rd St is a home located in Lake County with nearby schools including Oak Crest School, Beach Park Middle School, and Zion-Benton Township High School.
Ownership History
Date
Name
Owned For
Owner Type
Purchase Details
Closed on
Sep 9, 2011
Sold by
Garcia Alberto T and Garcia Ramona
Bought by
Garcia Alberto
Current Estimated Value
Purchase Details
Closed on
Feb 28, 2000
Sold by
Garcia Alberto T and Garcia Alberto
Bought by
Garcia Alberto T and Garcia Ramona
Home Financials for this Owner
Home Financials are based on the most recent Mortgage that was taken out on this home.
Original Mortgage
$128,000
Outstanding Balance
$43,818
Interest Rate
8.43%
Estimated Equity
$251,316
Purchase Details
Closed on
Aug 25, 1997
Sold by
Bjorn Dennis E and Lee Tracie L
Bought by
Garcia Alberto T and Garcia Ramona
Home Financials for this Owner
Home Financials are based on the most recent Mortgage that was taken out on this home.
Original Mortgage
$124,029
Interest Rate
7.54%
Mortgage Type
FHA
Purchase Details
Closed on
Apr 19, 1996
Sold by
Ruesch Herbert D
Bought by
Ruesch Edna
Create a Home Valuation Report for This Property
The Home Valuation Report is an in-depth analysis detailing your home's value as well as a comparison with similar homes in the area
Home Values in the Area
Average Home Value in this Area
Purchase History
| Date | Buyer | Sale Price | Title Company |
|---|---|---|---|
| Garcia Alberto | -- | None Available | |
| Garcia Alberto T | -- | -- | |
| Garcia Alberto T | $83,666 | -- | |
| Ruesch Edna | -- | -- | |
| Ruesch Edna | -- | Mid America Title Company | |
| Ruesch Edna | -- | Mid America Title Company | |
| Bjorn Dennis E | $20,000 | Chicago Title Insurance Co |
Source: Public Records
Mortgage History
| Date | Status | Borrower | Loan Amount |
|---|---|---|---|
| Open | Garcia Alberto T | $128,000 | |
| Closed | Garcia Alberto T | $124,029 |
Source: Public Records
Tax History Compared to Growth
Tax History
| Year | Tax Paid | Tax Assessment Tax Assessment Total Assessment is a certain percentage of the fair market value that is determined by local assessors to be the total taxable value of land and additions on the property. | Land | Improvement |
|---|---|---|---|---|
| 2024 | $9,602 | $86,869 | $8,842 | $78,027 |
| 2023 | $7,992 | $77,451 | $7,883 | $69,568 |
| 2022 | $7,992 | $61,915 | $6,493 | $55,422 |
| 2021 | $7,561 | $53,930 | $6,113 | $47,817 |
| 2020 | $7,356 | $50,725 | $5,750 | $44,975 |
| 2019 | $7,059 | $47,252 | $5,356 | $41,896 |
| 2018 | $6,839 | $44,986 | $5,155 | $39,831 |
| 2017 | $6,822 | $41,731 | $4,782 | $36,949 |
| 2016 | $6,366 | $37,882 | $4,341 | $33,541 |
| 2015 | $6,088 | $34,373 | $3,939 | $30,434 |
| 2014 | $6,469 | $36,770 | $4,078 | $32,692 |
| 2012 | $6,567 | $39,159 | $4,343 | $34,816 |
Source: Public Records
Map
Nearby Homes
- 3225 Gilead Ave
- 3224 Gilboa Ave
- 3221 Gideon Ave
- 2614 33rd St
- 3101 Gilboa Ave
- 10765 W Liberty Ave
- 2903 Gideon Ave
- 3200 Eshcol Ave
- 3016 Eshcol Ave
- 11345 W Carnahan Ave
- 2738 Gabriel Ave
- 2900 Bethel Blvd
- 1121 Otto Graham Ln
- 11342-11346 W Wadsworth Rd
- 3931 Bertrand Ln
- 11382 W Leland Ave
- 39161 N Holdridge Ave
- 3220 Emmaus Ave
- 10205 W Ames Ave
- 2819 Eshcol Ave
- 2309 33rd St
- 2311 33rd St
- 2205 33rd St
- 3314 Gilead Ave
- 3313 Gilead Ave
- 2321 33rd St
- 3316 Gilead Ave
- 3315 Gilead Ave
- 2203 33rd St
- 3244 Gilead Ave
- 3317 Gilead Ave
- 2323 33rd St Unit A
- 2323 33rd St
- 3318 Gilead Ave
- 3249 Gilead Ave
- 2325 33rd St
- 3241 Galilee Ave
- 3320 Gilead Ave
- 3315 Galilee Ave
- 2201 33rd St