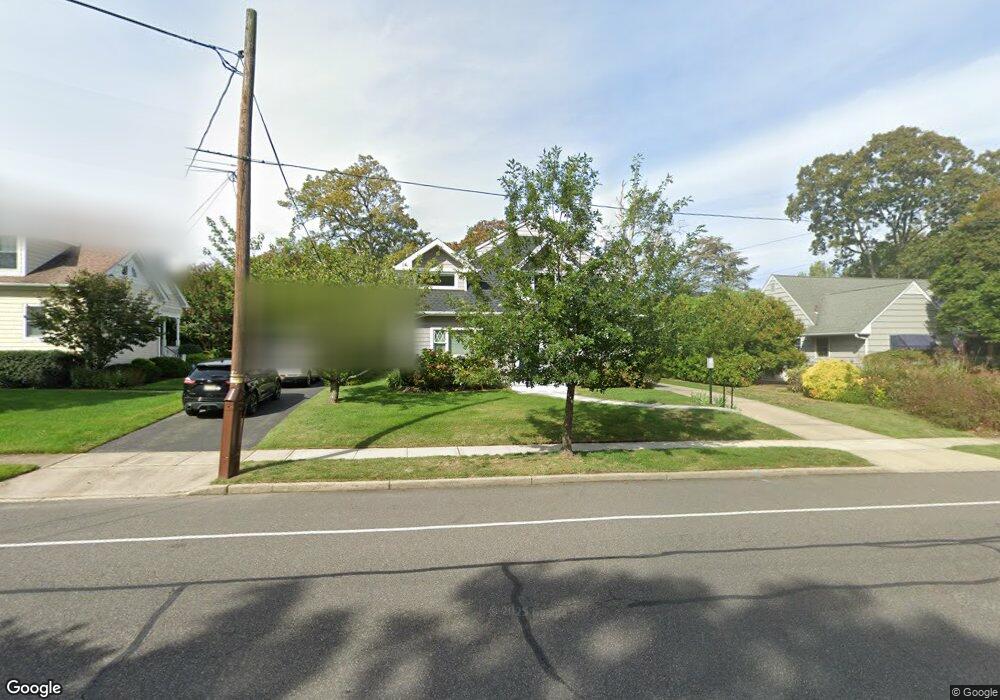
2307 3rd Ave Spring Lake, NJ 07762
Estimated Value: $3,212,646 - $3,756,000
--
Bed
3
Baths
2,741
Sq Ft
$1,275/Sq Ft
Est. Value
About This Home
This home is located at 2307 3rd Ave, Spring Lake, NJ 07762 and is currently estimated at $3,495,912, approximately $1,275 per square foot. 2307 3rd Ave is a home located in Monmouth County with nearby schools including St. Rose Grammar School and St Rose High School.
Ownership History
Date
Name
Owned For
Owner Type
Purchase Details
Closed on
Jun 30, 2017
Sold by
Froelich Biran P and Froelich Jeanne M
Bought by
Rothschild Michael and Rothschild Alison
Current Estimated Value
Purchase Details
Closed on
Apr 22, 2014
Sold by
Froelich Brian P and Froelich Lawrence C
Bought by
Marie And Jerome Froelich Family Llc
Purchase Details
Closed on
Feb 20, 2014
Sold by
Froelich Jerome J and Kirsner Catherine W
Bought by
Froelich Brian P and Froelich Lawrence C
Create a Home Valuation Report for This Property
The Home Valuation Report is an in-depth analysis detailing your home's value as well as a comparison with similar homes in the area
Home Values in the Area
Average Home Value in this Area
Purchase History
| Date | Buyer | Sale Price | Title Company |
|---|---|---|---|
| Rothschild Michael | $2,742,500 | None Available | |
| Marie And Jerome Froelich Family Llc | -- | None Available | |
| Froelich Brian P | -- | None Available |
Source: Public Records
Tax History Compared to Growth
Tax History
| Year | Tax Paid | Tax Assessment Tax Assessment Total Assessment is a certain percentage of the fair market value that is determined by local assessors to be the total taxable value of land and additions on the property. | Land | Improvement |
|---|---|---|---|---|
| 2025 | $9,181 | $2,007,000 | $1,387,000 | $620,000 |
| 2024 | $8,580 | $1,877,500 | $1,300,600 | $576,900 |
| 2023 | $8,580 | $1,705,800 | $1,142,400 | $563,400 |
| 2022 | $8,426 | $1,656,300 | $1,119,800 | $536,500 |
| 2021 | $8,426 | $1,404,400 | $919,200 | $485,200 |
| 2020 | $8,205 | $1,327,600 | $861,200 | $466,400 |
| 2019 | $8,179 | $1,298,300 | $845,400 | $452,900 |
| 2018 | $8,086 | $1,287,500 | $845,400 | $442,100 |
| 2017 | $7,908 | $1,263,200 | $845,400 | $417,800 |
| 2016 | $9,881 | $1,446,700 | $1,099,800 | $346,900 |
| 2015 | $9,910 | $1,419,700 | $1,072,800 | $346,900 |
| 2014 | $9,415 | $1,372,400 | $1,025,500 | $346,900 |
Source: Public Records
Map
Nearby Homes
- 1905 3rd Ave
- 737 20th Ave
- 1813 Margerum Ave
- 1027 2nd Ave
- 15 Wyckham Rd
- 12 Wyckham Rd
- 1825 Pine Terrace
- 708 18th Ave
- 1807-1809 Laurel Terrace
- 1800-1802 Pine Terrace
- 905 Wall Rd
- 620 Redmond Ave
- 1730 Newman St
- 1012 Glenn St
- 1014 Glenn St
- 615 17th Ave
- 204 19th Ave
- 1024 17th Ave
- 1803 Surf Ave
- 1211 18th Ave