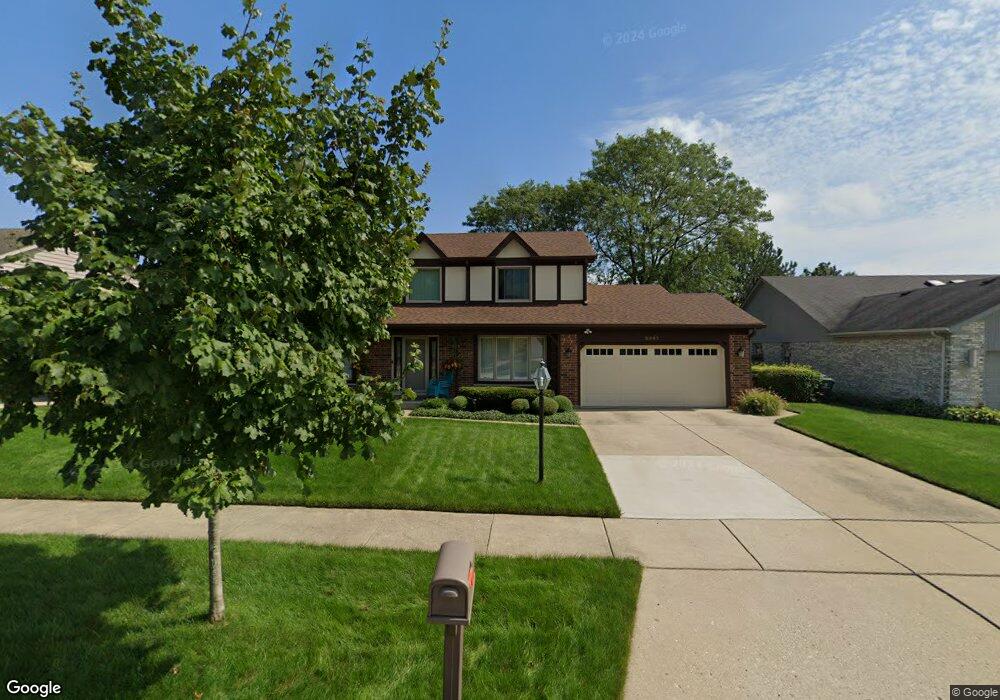
2307 Phillips Dr Glenview, IL 60026
The Willows NeighborhoodEstimated Value: $831,324 - $1,016,000
4
Beds
3
Baths
2,722
Sq Ft
$332/Sq Ft
Est. Value
About This Home
This home is located at 2307 Phillips Dr, Glenview, IL 60026 and is currently estimated at $902,831, approximately $331 per square foot. 2307 Phillips Dr is a home located in Cook County with nearby schools including Willowbrook Elementary School, Maple School, and Glenbrook South High School.
Create a Home Valuation Report for This Property
The Home Valuation Report is an in-depth analysis detailing your home's value as well as a comparison with similar homes in the area
Home Values in the Area
Average Home Value in this Area
Tax History
| Year | Tax Paid | Tax Assessment Tax Assessment Total Assessment is a certain percentage of the fair market value that is determined by local assessors to be the total taxable value of land and additions on the property. | Land | Improvement |
|---|---|---|---|---|
| 2025 | $12,306 | $86,001 | $16,517 | $69,484 |
| 2024 | $12,306 | $59,090 | $14,014 | $45,076 |
| 2023 | $12,410 | $59,090 | $14,014 | $45,076 |
| 2022 | $12,410 | $61,105 | $14,014 | $47,091 |
| 2021 | $10,826 | $48,303 | $11,761 | $36,542 |
| 2020 | $10,783 | $48,303 | $11,761 | $36,542 |
| 2019 | $10,335 | $53,081 | $11,761 | $41,320 |
| 2018 | $10,340 | $48,912 | $10,260 | $38,652 |
| 2017 | $11,074 | $52,777 | $10,260 | $42,517 |
| 2016 | $11,190 | $56,169 | $10,260 | $45,909 |
| 2015 | $10,876 | $49,647 | $8,258 | $41,389 |
| 2014 | $10,699 | $49,647 | $8,258 | $41,389 |
| 2013 | $10,534 | $49,647 | $8,258 | $41,389 |
Source: Public Records
Map
Nearby Homes
- 3501 Lawson Rd
- 102 Yale Ct Unit 34LH10
- 2571 Essex Dr
- 3820 Kiess Dr
- 3800 Kiess Dr
- 3100 Lexington Ln Unit 312
- 2230 Goldenrod Ln
- 2050 Valencia Dr Unit 300C
- 2050 Valencia Dr Unit 405C
- 1615 Greenwood Rd
- 1605 Elmdale Ave
- 1867 Admiral Ct Unit 91
- 2464 Violet St
- 4142 Hampton Ct
- 2408 Violet St
- 1813 Admiral Ct Unit 118
- 3190 Landwehr Rd
- 3005 Highland Rd
- 3246 Landwehr Rd Unit 3
- 2701 Commons Dr Unit 210
- 2301 Phillips Dr
- 2313 Phillips Dr
- 2310 Janet Dr
- 2300 Janet Dr
- 2247 Phillips Dr
- 2319 Phillips Dr
- 2248 Janet Dr
- 2310 Phillips Dr
- 2318 Janet Dr
- 2302 Phillips Dr
- 2316 Phillips Dr
- 2243 Phillips Dr
- 2250 Phillips Dr
- 2244 Janet Dr
- 2322 Phillips Dr
- 3225 Brandess Dr
- 3217 Brandess Dr
- 3208 Barbara Dr
- 2244 Phillips Dr
- 3213 Brandess Dr
Your Personal Tour Guide
Ask me questions while you tour the home.