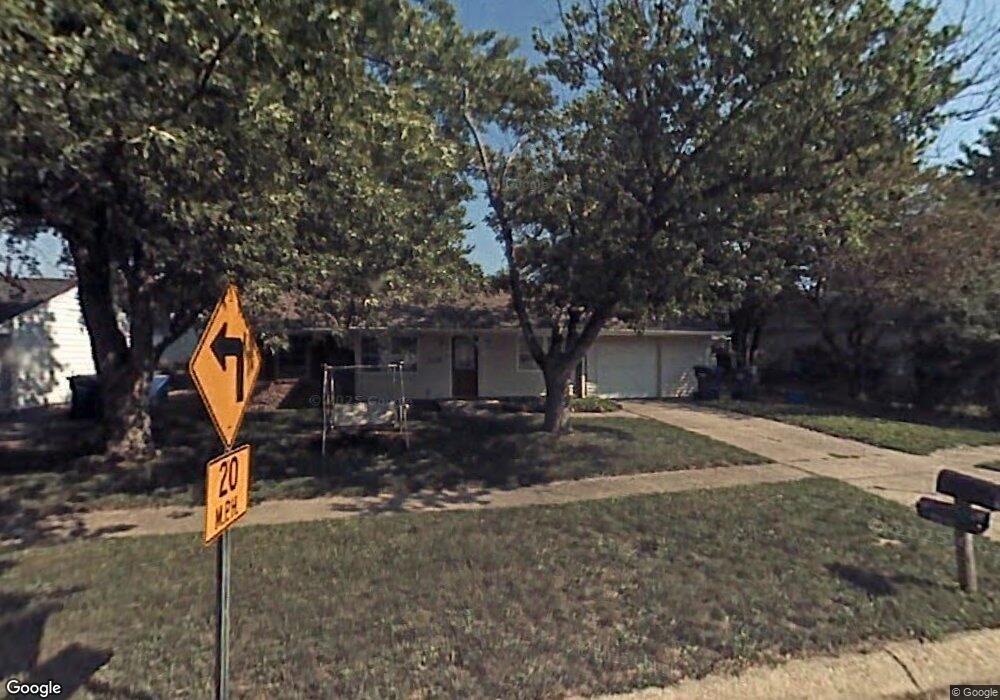
2308 Ashbourne Rd Anderson, IN 46011
Estimated Value: $130,000 - $145,000
3
Beds
1
Bath
925
Sq Ft
$146/Sq Ft
Est. Value
About This Home
This home is located at 2308 Ashbourne Rd, Anderson, IN 46011 and is currently estimated at $135,071, approximately $146 per square foot. 2308 Ashbourne Rd is a home located in Madison County with nearby schools including Edgewood Elementary School, Highland Middle School, and Anderson High School.
Ownership History
Date
Name
Owned For
Owner Type
Purchase Details
Closed on
Jan 16, 2023
Sold by
Hart Ronald E
Bought by
Mjh Properties Inc
Current Estimated Value
Purchase Details
Closed on
Nov 4, 2022
Sold by
Hart Michael J
Bought by
Markle Susan J
Purchase Details
Closed on
May 13, 2011
Sold by
Noblitt William
Bought by
Hart Ronald E and Hart Michael J
Purchase Details
Closed on
Sep 28, 2006
Sold by
Evolution Housing Group Inc
Bought by
Noblitt William
Home Financials for this Owner
Home Financials are based on the most recent Mortgage that was taken out on this home.
Original Mortgage
$63,920
Interest Rate
8.32%
Mortgage Type
Adjustable Rate Mortgage/ARM
Purchase Details
Closed on
Jun 26, 2006
Sold by
Jackson Alphonso and Secretary Of Hud
Bought by
Evolution Housing Group Inc
Purchase Details
Closed on
Sep 26, 2005
Sold by
U S Bank Na
Bought by
The Secretary Of Hud
Create a Home Valuation Report for This Property
The Home Valuation Report is an in-depth analysis detailing your home's value as well as a comparison with similar homes in the area
Home Values in the Area
Average Home Value in this Area
Purchase History
| Date | Buyer | Sale Price | Title Company |
|---|---|---|---|
| Mjh Properties Inc | -- | -- | |
| Markle Susan J | -- | -- | |
| Hart Ronald E | $9,961 | -- | |
| Noblitt William | -- | -- | |
| Evolution Housing Group Inc | -- | -- | |
| The Secretary Of Hud | -- | -- |
Source: Public Records
Mortgage History
| Date | Status | Borrower | Loan Amount |
|---|---|---|---|
| Previous Owner | Noblitt William | $63,920 | |
| Closed | Evolution Housing Group Inc | $0 |
Source: Public Records
Tax History
| Year | Tax Paid | Tax Assessment Tax Assessment Total Assessment is a certain percentage of the fair market value that is determined by local assessors to be the total taxable value of land and additions on the property. | Land | Improvement |
|---|---|---|---|---|
| 2025 | $1,193 | $58,500 | $10,700 | $47,800 |
| 2024 | $1,193 | $53,700 | $10,700 | $43,000 |
| 2023 | $1,087 | $48,600 | $10,200 | $38,400 |
| 2022 | $1,201 | $53,700 | $9,900 | $43,800 |
| 2021 | $1,067 | $47,400 | $9,400 | $38,000 |
| 2020 | $976 | $43,200 | $9,000 | $34,200 |
| 2019 | $993 | $43,900 | $9,000 | $34,900 |
| 2018 | $900 | $39,000 | $6,700 | $32,300 |
| 2017 | $780 | $39,000 | $6,700 | $32,300 |
| 2016 | $780 | $39,000 | $6,700 | $32,300 |
| 2014 | $780 | $39,000 | $6,700 | $32,300 |
| 2013 | $780 | $39,000 | $6,700 | $32,300 |
Source: Public Records
Map
Nearby Homes
- 1902 Edgemont Way
- 1832 Norwood Way
- 1828 Norwood Way
- 1903 Norwood Place
- 1705 Woodbine Dr
- 1913 Norwood Place
- 2322 Aspen Ct
- 2124 Jackson Ln
- 2167 Jackson Ln
- Lot 2 Vanderbilt Dr
- Lot 33 Doe Meadow Dr
- Lot 28 Doe Meadow Dr
- 1641 Hillcrest Ave
- 2405 Sagamore Dr
- 0 Cross East St Unit MBR22084643
- 2327 Mimosa Ln
- 1920 van Buskirk Rd
- 1321 Greenway Dr
- 824 W Vinyard St
- 1820 Whittier Ave
- 2312 Ashbourne Rd
- 2304 Ashbourne Rd
- 1905 Edgemont Way
- 1909 Edgemont Way
- 2316 Ashbourne Rd
- 1822 W Fairlawn Way
- 2307 Ashbourne Rd
- 1916 Woodbine Dr
- 2303 Ashbourne Rd
- 1913 Edgemont Way
- 1827 W Fairlawn Way
- 1920 Woodbine Dr
- 1906 Edgemont Way
- 2319 Woodbine Dr
- 2308 Edgemont Way
- 1818 W Fairlawn Way
- 1817 E Fairlawn Way
- 2304 Edgemont Way
- 1823 W Fairlawn Way
- 2219 Ashbourne Rd
Your Personal Tour Guide
Ask me questions while you tour the home.