Estimated Value: $171,000 - $197,000
2
Beds
2
Baths
1,200
Sq Ft
$151/Sq Ft
Est. Value
About This Home
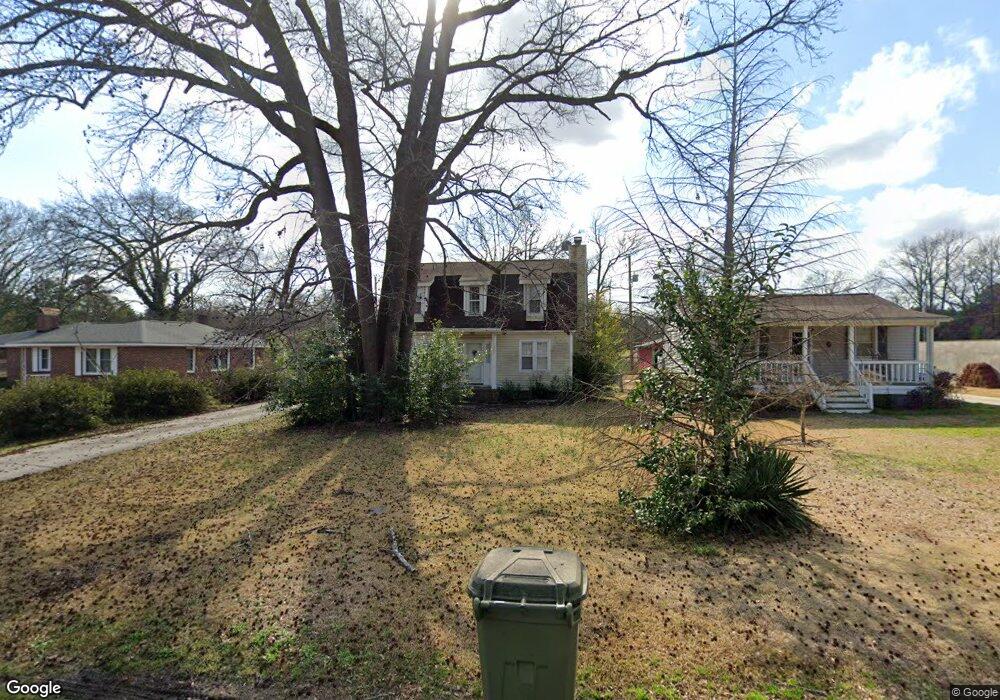
This home is located at 2308 Baxter St, Cayce, SC 29033 and is currently estimated at $181,668, approximately $151 per square foot. 2308 Baxter St is a home located in Lexington County with nearby schools including Cayce Elementary, Cyril B. Busbee Creative Arts Academy, and Brookland-Cayce High School.
Ownership History
Date
Name
Owned For
Owner Type
Purchase Details
Closed on
Aug 15, 2016
Sold by
Mccarty Billy and Mccarty Becky
Bought by
Davis Richard L
Current Estimated Value
Home Financials for this Owner
Home Financials are based on the most recent Mortgage that was taken out on this home.
Original Mortgage
$81,720
Outstanding Balance
$65,055
Interest Rate
3.41%
Mortgage Type
VA
Estimated Equity
$116,613
Purchase Details
Closed on
Apr 3, 2014
Sold by
Mccarty Becky and Van Loozen Becky
Bought by
Mccarty Becky and Mccarty Billy
Purchase Details
Closed on
Aug 20, 2004
Sold by
Federal Home Loan Mortgage Corporation
Bought by
Vanloozen Becky
Purchase Details
Closed on
Jul 22, 2004
Sold by
Vonbirgelen Josette J and Mortgage Electronic Registrati
Bought by
Federal Home Loan Mortgage Corporation
Purchase Details
Closed on
Jan 14, 2000
Sold by
Hiers Ronda L
Bought by
Birgelen Josetti J Von
Create a Home Valuation Report for This Property
The Home Valuation Report is an in-depth analysis detailing your home's value as well as a comparison with similar homes in the area
Home Values in the Area
Average Home Value in this Area
Purchase History
| Date | Buyer | Sale Price | Title Company |
|---|---|---|---|
| Davis Richard L | -- | None Available | |
| Mccarty Becky | -- | -- | |
| Vanloozen Becky | $69,500 | -- | |
| Federal Home Loan Mortgage Corporation | $25,000 | -- | |
| Birgelen Josetti J Von | $67,000 | -- |
Source: Public Records
Mortgage History
| Date | Status | Borrower | Loan Amount |
|---|---|---|---|
| Open | Davis Richard L | $81,720 |
Source: Public Records
Tax History
| Year | Tax Paid | Tax Assessment Tax Assessment Total Assessment is a certain percentage of the fair market value that is determined by local assessors to be the total taxable value of land and additions on the property. | Land | Improvement |
|---|---|---|---|---|
| 2024 | $2,190 | $5,230 | $840 | $4,390 |
| 2023 | $2,009 | $5,230 | $840 | $4,390 |
| 2022 | $1,878 | $5,230 | $840 | $4,390 |
| 2020 | $1,793 | $5,230 | $840 | $4,390 |
| 2019 | $1,663 | $4,800 | $840 | $3,960 |
| 2018 | $1,629 | $4,800 | $840 | $3,960 |
| 2017 | $1,605 | $4,800 | $840 | $3,960 |
| 2016 | $585 | $3,404 | $560 | $2,844 |
| 2014 | $466 | $3,709 | $460 | $3,249 |
| 2013 | -- | $3,710 | $460 | $3,250 |
Source: Public Records
Map
Nearby Homes
- 2312 Lucas St
- 1740 Sunnyside Dr
- 1818 Sunnyside Dr
- 000 Frink St
- 2314 Orchard St
- 1515 Benedict St
- 103 Pine Ln
- 1512 Summerland Dr
- 1805 Chadsworth Dr
- 2402 Breezewood Rd
- 1832 Wadsworth Dr
- 133 Odell Dr
- 129 Odell Dr
- 121 Odell Dr
- 117 Odell Dr
- 1414 Hazel St
- 1521 Benton Cir
- 1137 Allen St
- 207 Haynes Ln
- 107 Cherry Ln
Your Personal Tour Guide
Ask me questions while you tour the home.