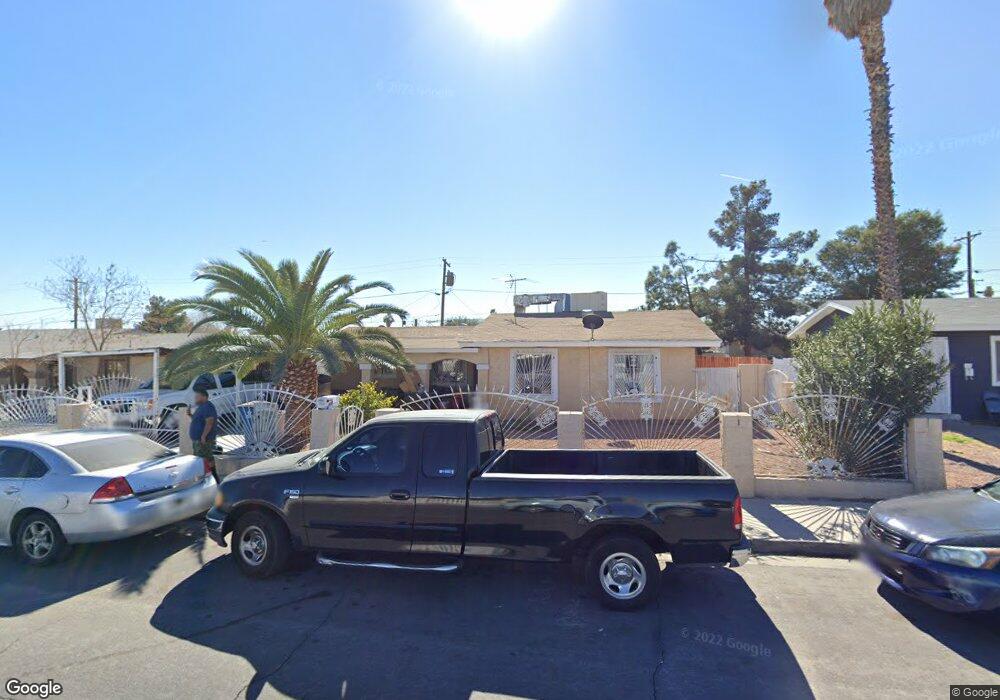
2308 Berkley Ave Las Vegas, NV 89101
Downtown Las Vegas NeighborhoodEstimated Value: $310,000 - $343,000
4
Beds
3
Baths
1,734
Sq Ft
$184/Sq Ft
Est. Value
About This Home
This home is located at 2308 Berkley Ave, Las Vegas, NV 89101 and is currently estimated at $319,749, approximately $184 per square foot. 2308 Berkley Ave is a home located in Clark County with nearby schools including Sunrise Acres Elementary School, Roy West Martin Middle School, and Valley High School.
Ownership History
Date
Name
Owned For
Owner Type
Purchase Details
Closed on
Jun 25, 2008
Sold by
Perez Jesus
Bought by
Perez Jesus and Perez Marta Valerio
Current Estimated Value
Purchase Details
Closed on
Oct 26, 2005
Sold by
Perez Martha
Bought by
Perez Jesus
Home Financials for this Owner
Home Financials are based on the most recent Mortgage that was taken out on this home.
Original Mortgage
$47,000
Outstanding Balance
$25,183
Interest Rate
5.68%
Mortgage Type
New Conventional
Estimated Equity
$294,566
Purchase Details
Closed on
Aug 20, 1999
Sold by
Rodriguez Celso
Bought by
Perez Jesus and Perez Martha
Purchase Details
Closed on
Apr 15, 1994
Sold by
Harris Stephen and Perez Marta
Bought by
Perez Jesus and Rodriguez Celso
Home Financials for this Owner
Home Financials are based on the most recent Mortgage that was taken out on this home.
Original Mortgage
$74,100
Interest Rate
7.67%
Create a Home Valuation Report for This Property
The Home Valuation Report is an in-depth analysis detailing your home's value as well as a comparison with similar homes in the area
Home Values in the Area
Average Home Value in this Area
Purchase History
| Date | Buyer | Sale Price | Title Company |
|---|---|---|---|
| Perez Jesus | -- | None Available | |
| Perez Jesus | -- | Community Title | |
| Perez Jesus | $2,000 | -- | |
| Perez Jesus | $78,000 | Land Title |
Source: Public Records
Mortgage History
| Date | Status | Borrower | Loan Amount |
|---|---|---|---|
| Open | Perez Jesus | $47,000 | |
| Previous Owner | Perez Jesus | $74,100 |
Source: Public Records
Tax History Compared to Growth
Tax History
| Year | Tax Paid | Tax Assessment Tax Assessment Total Assessment is a certain percentage of the fair market value that is determined by local assessors to be the total taxable value of land and additions on the property. | Land | Improvement |
|---|---|---|---|---|
| 2025 | $765 | $57,992 | $27,720 | $30,272 |
| 2024 | $743 | $57,992 | $27,720 | $30,272 |
| 2023 | $743 | $54,157 | $26,250 | $27,907 |
| 2022 | $721 | $41,131 | $15,750 | $25,381 |
| 2021 | $700 | $38,238 | $14,350 | $23,888 |
| 2020 | $701 | $37,828 | $14,350 | $23,478 |
| 2019 | $657 | $35,892 | $12,950 | $22,942 |
| 2018 | $627 | $33,783 | $11,900 | $21,883 |
| 2017 | $1,007 | $30,721 | $8,750 | $21,971 |
| 2016 | $589 | $27,331 | $5,600 | $21,731 |
| 2015 | $586 | $25,695 | $4,550 | $21,145 |
| 2014 | $568 | $24,883 | $4,375 | $20,508 |
Source: Public Records
Map
Nearby Homes
- 2408 Berkley Ave
- 209 N 21st St
- 2528 Sunrise Ave
- 802 Stewart Ave
- 2538 Valley St
- 121 N 20th St
- 2510 Sunrise St
- 2520 Sunrise St
- 50 N 27th St
- 244 N 19th St
- 2002 Marlin Ave
- 223 Tower St
- 1905 Stewart Ave
- 241 N 19th St
- 208 N Bruce St Unit A
- 208 N Bruce St Unit C
- 200 N Bruce St Unit A
- 215 N Bruce St
- 2812 Marlin Ave
- 2513 Cedar Ave
- 2304 Berkley Ave
- 2312 Berkley Ave
- 2309 Isabelle Ave
- 2313 Isabelle Ave
- 2316 Berkley Ave
- 2305 Isabelle Ave
- 2300 Berkley Ave
- 2309 Berkley Ave
- 2317 Isabelle Ave
- 2305 Berkley Ave
- 2313 Berkley Ave
- 2301 Isabelle Ave
- 2400 Berkley Ave
- 2124 Berkley Ave
- 2301 Berkley Ave
- 2317 Berkley Ave
- 2401 Isabelle Ave
- 2213 Isabelle Ave
- 2401 Berkley Ave
- 2213 Berkley Ave