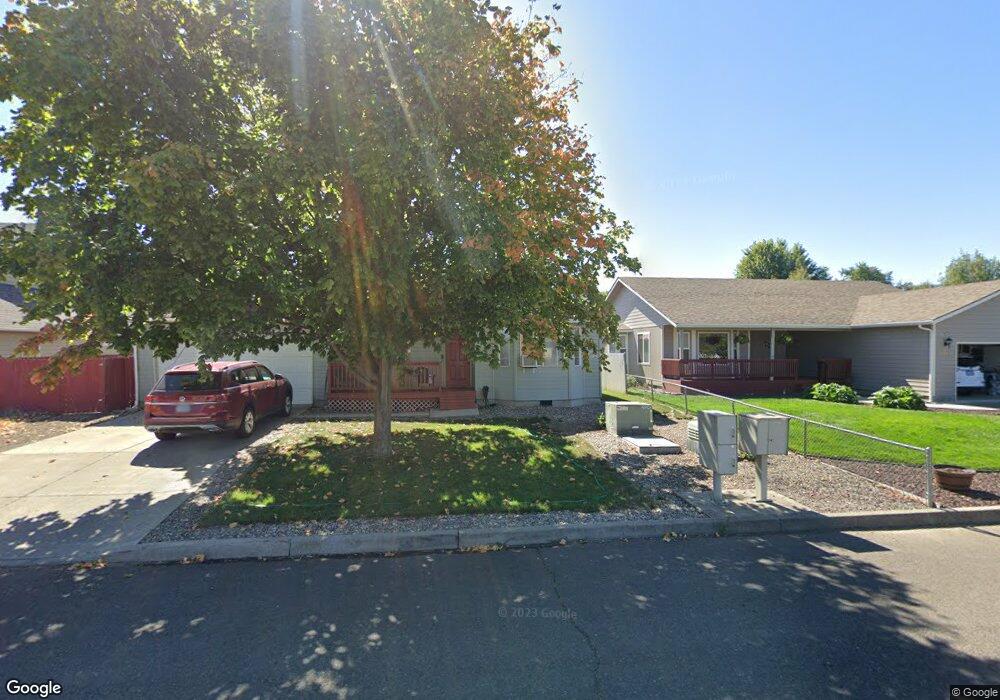
2308 E N Ct La Grande, OR 97850
Estimated Value: $310,990
3
Beds
2
Baths
1,272
Sq Ft
$244/Sq Ft
Est. Value
About This Home
This home is located at 2308 E N Ct, La Grande, OR 97850 and is currently estimated at $310,990, approximately $244 per square foot. 2308 E N Ct is a home located in Union County with nearby schools including La Grande High School, The Marian Academy, and Grande Ronde Academy.
Ownership History
Date
Name
Owned For
Owner Type
Purchase Details
Closed on
Aug 26, 2009
Sold by
Macdonald Gregg A and Macdonald Marcia A
Bought by
Kailang Shelvin D and Elobt Elilai S
Current Estimated Value
Home Financials for this Owner
Home Financials are based on the most recent Mortgage that was taken out on this home.
Original Mortgage
$170,408
Outstanding Balance
$111,446
Interest Rate
5.19%
Mortgage Type
New Conventional
Estimated Equity
$199,544
Create a Home Valuation Report for This Property
The Home Valuation Report is an in-depth analysis detailing your home's value as well as a comparison with similar homes in the area
Purchase History
| Date | Buyer | Sale Price | Title Company |
|---|---|---|---|
| Kailang Shelvin D | $167,000 | Abstract & Title Company |
Source: Public Records
Mortgage History
| Date | Status | Borrower | Loan Amount |
|---|---|---|---|
| Open | Kailang Shelvin D | $170,408 |
Source: Public Records
Tax History
| Year | Tax Paid | Tax Assessment Tax Assessment Total Assessment is a certain percentage of the fair market value that is determined by local assessors to be the total taxable value of land and additions on the property. | Land | Improvement |
|---|---|---|---|---|
| 2025 | $3,068 | $169,550 | $42,890 | $126,660 |
| 2024 | $2,964 | $164,620 | $41,640 | $122,980 |
| 2023 | $2,911 | $159,830 | $40,420 | $119,410 |
| 2022 | $2,833 | $155,166 | $39,238 | $115,928 |
| 2021 | $2,762 | $150,647 | $38,577 | $112,070 |
| 2020 | $2,651 | $146,260 | $37,481 | $108,779 |
| 2019 | $2,595 | $142,000 | $36,607 | $105,393 |
| 2018 | $2,527 | $137,865 | $35,824 | $102,041 |
| 2017 | $2,455 | $133,850 | $31,177 | $102,673 |
| 2016 | $2,381 | $129,952 | $30,328 | $99,624 |
Source: Public Records
Map
Nearby Homes
- 2311 E L Ave
- 2410 E N Ave
- 2407 E O Ave
- 2505 Cove Ave
- 2501 Cove Ave
- 0 Tax Id 19401 Unit 665044590
- 1408 N Cherry St
- 1906 Island Ave
- 512 20th St
- 1908 1906 1/2 Adams Ave
- 2102 True Loop
- 2004 True Loop
- 0 Tax Id 19400 Unit 586023427
- 2129 Elevation Ct
- 2132 Elevation Ct
- 1516 Monroe Ave
- 1305 9th St
- 1503 R Ave
- 2209 Terra Lee Ct
- 1302 9th St
Your Personal Tour Guide
Ask me questions while you tour the home.