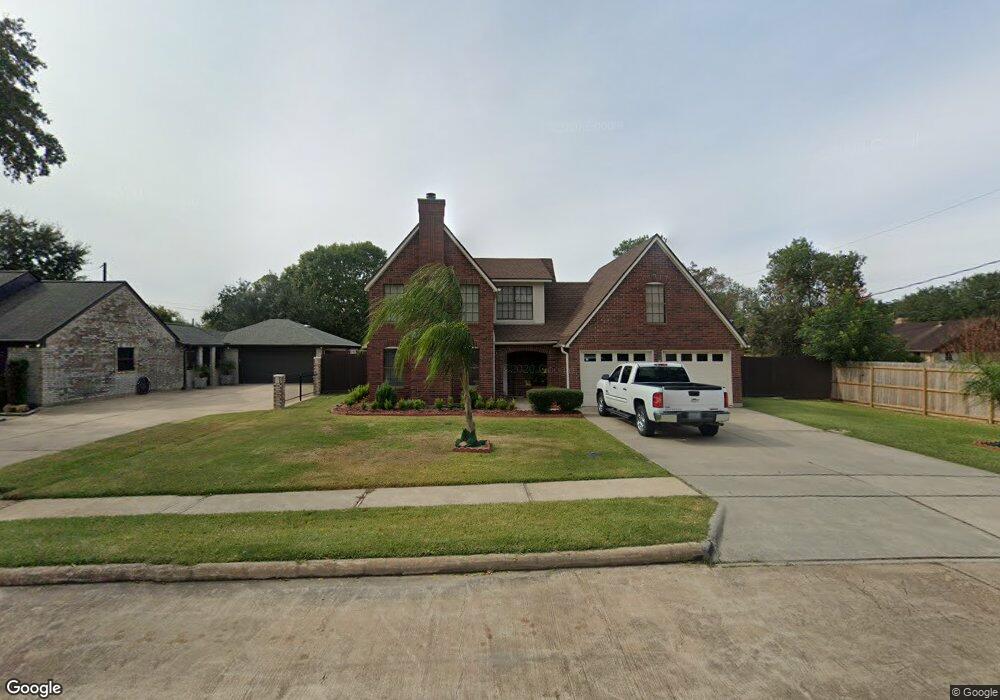
2308 Lynn Dr Pearland, TX 77581
Estimated Value: $274,000 - $304,000
3
Beds
3
Baths
1,842
Sq Ft
$159/Sq Ft
Est. Value
About This Home
This home is located at 2308 Lynn Dr, Pearland, TX 77581 and is currently estimated at $292,256, approximately $158 per square foot. 2308 Lynn Dr is a home located in Brazoria County with nearby schools including Barbara Cockrell Elementary School, Pearland Junior High School West, and Leon H. Sablatura Middle School.
Ownership History
Date
Name
Owned For
Owner Type
Purchase Details
Closed on
May 21, 2015
Sold by
Secretary Of Hsng & Urban Development
Bought by
Fonseca Juan Ramon
Current Estimated Value
Home Financials for this Owner
Home Financials are based on the most recent Mortgage that was taken out on this home.
Original Mortgage
$134,518
Outstanding Balance
$105,726
Interest Rate
4.25%
Mortgage Type
FHA
Estimated Equity
$186,530
Purchase Details
Closed on
Jul 23, 2014
Sold by
Citimortgage Inc
Bought by
Secretary Of Hud
Purchase Details
Closed on
May 13, 2014
Sold by
Martinez Luis A and Martinez Susana
Bought by
Citimortgage Inc
Purchase Details
Closed on
Mar 13, 2003
Sold by
Cunningham Kyle Wayne and Cunningham Kimberly
Bought by
Martinez Luis A and Martinez Susana
Home Financials for this Owner
Home Financials are based on the most recent Mortgage that was taken out on this home.
Original Mortgage
$132,609
Interest Rate
5.86%
Mortgage Type
FHA
Create a Home Valuation Report for This Property
The Home Valuation Report is an in-depth analysis detailing your home's value as well as a comparison with similar homes in the area
Home Values in the Area
Average Home Value in this Area
Purchase History
| Date | Buyer | Sale Price | Title Company |
|---|---|---|---|
| Fonseca Juan Ramon | -- | South Land Title Llc | |
| Secretary Of Hud | -- | None Available | |
| Citimortgage Inc | $137,015 | None Available | |
| Martinez Luis A | -- | Chicago Title Insurance Co |
Source: Public Records
Mortgage History
| Date | Status | Borrower | Loan Amount |
|---|---|---|---|
| Open | Fonseca Juan Ramon | $134,518 | |
| Previous Owner | Martinez Luis A | $132,609 |
Source: Public Records
Tax History Compared to Growth
Tax History
| Year | Tax Paid | Tax Assessment Tax Assessment Total Assessment is a certain percentage of the fair market value that is determined by local assessors to be the total taxable value of land and additions on the property. | Land | Improvement |
|---|---|---|---|---|
| 2025 | $6,122 | $279,950 | $17,550 | $262,400 |
| 2023 | $6,122 | $283,100 | $17,550 | $265,550 |
| 2022 | $5,002 | $207,950 | $17,550 | $190,400 |
| 2021 | $4,700 | $182,420 | $17,550 | $164,870 |
| 2020 | $4,922 | $182,420 | $17,550 | $164,870 |
| 2019 | $4,482 | $166,090 | $17,550 | $148,540 |
| 2018 | $4,718 | $175,600 | $19,500 | $156,100 |
| 2017 | $4,742 | $175,600 | $19,500 | $156,100 |
| 2016 | $4,598 | $170,270 | $19,500 | $150,770 |
| 2014 | -- | $136,090 | $19,500 | $116,590 |
Source: Public Records
Map
Nearby Homes
- 5208 Cunningham Dr
- 2304 Lynn Dr
- 2322 Francis Dr
- 4804 W Plum St
- 2312 Willow Blvd
- 2315 Cedar St
- 2317 Cedar St
- 5602 Megan St
- 4610 & 4612 W Orange St
- 0 Hatfield Rd Unit 37845028
- 2245 N Austin Ave
- 5013 Camden Ln
- 4615 W Walnut St
- 5205 Carmona Ln
- 2321 Pearland Ave
- 5208 Carmona Ln
- 2102 Pearland Ave
- 5604 Broadway St
- 0 Hatfield County Rd 480 Rd Unit 20764256
- 4901 Shank Rd