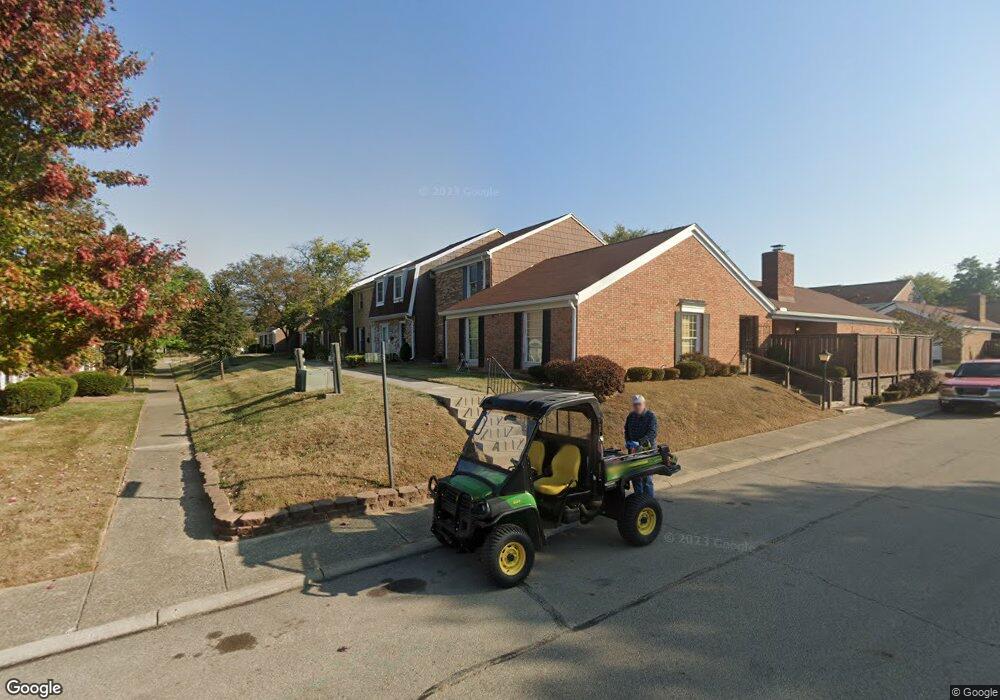
2308 Regency Ct Fairborn, OH 45324
Estimated Value: $154,559 - $160,000
3
Beds
3
Baths
1,360
Sq Ft
$116/Sq Ft
Est. Value
About This Home
This home is located at 2308 Regency Ct, Fairborn, OH 45324 and is currently estimated at $157,390, approximately $115 per square foot. 2308 Regency Ct is a home located in Greene County with nearby schools including Fairborn Primary School, Fairborn Intermediate School, and Fairborn Middle School.
Ownership History
Date
Name
Owned For
Owner Type
Purchase Details
Closed on
Aug 27, 2020
Sold by
Krzak Robert S
Bought by
Gahris Alison L
Current Estimated Value
Home Financials for this Owner
Home Financials are based on the most recent Mortgage that was taken out on this home.
Original Mortgage
$116,303
Outstanding Balance
$103,211
Interest Rate
2.9%
Mortgage Type
New Conventional
Estimated Equity
$54,179
Purchase Details
Closed on
Feb 7, 2017
Sold by
Robinette Kenneth and Robinette Laura
Bought by
Krzak Robert S
Home Financials for this Owner
Home Financials are based on the most recent Mortgage that was taken out on this home.
Original Mortgage
$92,297
Interest Rate
4.62%
Mortgage Type
FHA
Purchase Details
Closed on
Apr 7, 2015
Sold by
Barringer June E
Bought by
Federal National Mortgage Association
Create a Home Valuation Report for This Property
The Home Valuation Report is an in-depth analysis detailing your home's value as well as a comparison with similar homes in the area
Home Values in the Area
Average Home Value in this Area
Purchase History
| Date | Buyer | Sale Price | Title Company |
|---|---|---|---|
| Gahris Alison L | $119,900 | None Available | |
| Krzak Robert S | $94,000 | Vantage Land Title | |
| Federal National Mortgage Association | $65,000 | None Available |
Source: Public Records
Mortgage History
| Date | Status | Borrower | Loan Amount |
|---|---|---|---|
| Open | Gahris Alison L | $116,303 | |
| Previous Owner | Krzak Robert S | $92,297 |
Source: Public Records
Tax History Compared to Growth
Tax History
| Year | Tax Paid | Tax Assessment Tax Assessment Total Assessment is a certain percentage of the fair market value that is determined by local assessors to be the total taxable value of land and additions on the property. | Land | Improvement |
|---|---|---|---|---|
| 2024 | $1,834 | $38,300 | $2,520 | $35,780 |
| 2023 | $1,834 | $38,300 | $2,520 | $35,780 |
| 2022 | $1,800 | $31,650 | $2,520 | $29,130 |
| 2021 | $1,827 | $31,650 | $2,520 | $29,130 |
| 2020 | $1,836 | $31,650 | $2,520 | $29,130 |
| 2019 | $1,446 | $24,940 | $2,520 | $22,420 |
| 2018 | $1,461 | $24,460 | $2,520 | $21,940 |
| 2017 | $1,401 | $24,460 | $2,520 | $21,940 |
| 2016 | $1,402 | $23,920 | $2,520 | $21,400 |
| 2015 | $1,059 | $23,920 | $2,520 | $21,400 |
| 2014 | $734 | $23,920 | $2,520 | $21,400 |
Source: Public Records
Map
Nearby Homes
- 3306 Westchester Ct
- 2113 Wellington Ct
- 1022 Stoneybrook Trail
- 1695 Wimbledon Dr
- 1901 Armstrong Rd
- 606 Hillcrest Dr
- 0 W Yellow Springs-Fairfield Rd
- 625 Sharon Dr
- 4679 Byron Rd
- 654 Sartell Dr
- 618 Sartell Dr
- 540 Dorado Dr
- 4863 Horseman Dr
- 1215 Cottage Court Dr
- 1415 Artesian Ln
- 164 Cresting Rd
- 1137 Landsdale Dr
- 1101 Baywood Dr
- 70 Waterford Blvd
- 1036 Peidmont Dr
- 2310 Regency Ct
- 2306 Regency Ct
- 2304 Regency Ct
- 2312 Regency Ct
- 2314 Regency Ct
- 2307 Regency Ct
- 2409 Rona Village Blvd
- 2407 Rona Village Blvd
- 2313 Regency Ct
- 2405 Rona Village Blvd
- 2316 Regency Ct
- 2309 Regency Ct
- 2411 Rona Village Blvd
- 2305 Regency Ct
- 2413 Rona Village Blvd
- 3310 Westchester Ct
- 2317 Regency Ct
- 2318 Regency Ct
- 2321 Regency Ct
- 2415 Rona Village Blvd