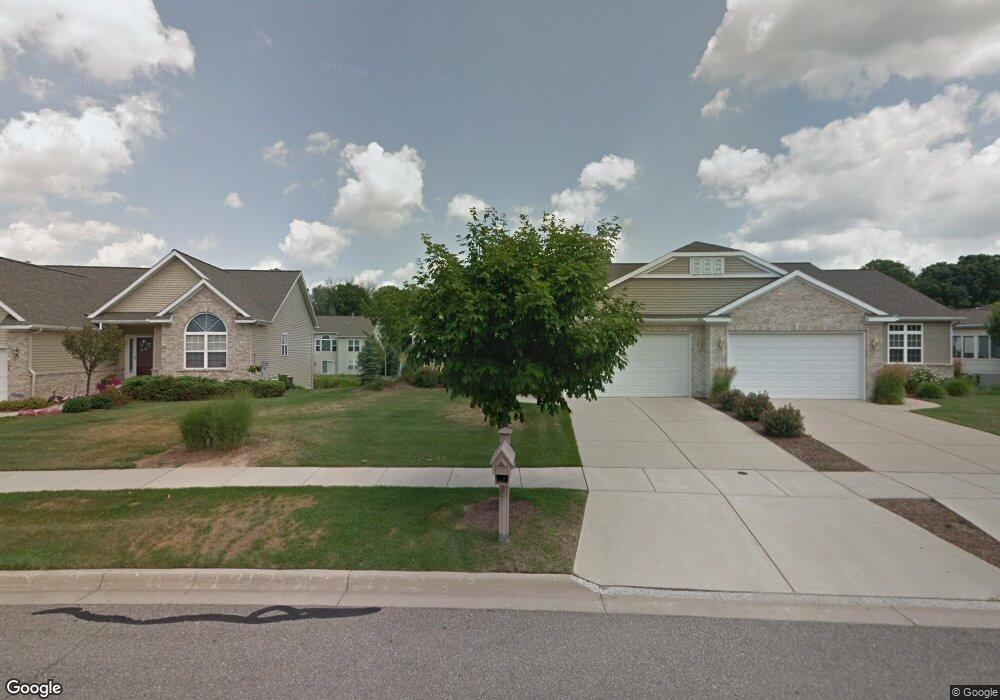
2308 Sapphire Ln Unit 5 East Lansing, MI 48823
Estimated Value: $392,897 - $461,000
2
Beds
2
Baths
1,360
Sq Ft
$304/Sq Ft
Est. Value
About This Home
This home is located at 2308 Sapphire Ln Unit 5, East Lansing, MI 48823 and is currently estimated at $413,474, approximately $304 per square foot. 2308 Sapphire Ln Unit 5 is a home located in Ingham County with nearby schools including Bennett Woods Elementary School, Kinawa School, and Chippewa Middle School.
Ownership History
Date
Name
Owned For
Owner Type
Purchase Details
Closed on
Feb 19, 2025
Sold by
Mcclendon John H and Mcclendon Deborah L
Bought by
Mcclendon John H and Mcclendon John H
Current Estimated Value
Purchase Details
Closed on
Jan 27, 2010
Sold by
Jim Giguere Builders Inc
Bought by
Mcclendon John H
Home Financials for this Owner
Home Financials are based on the most recent Mortgage that was taken out on this home.
Original Mortgage
$264,981
Interest Rate
5.2%
Mortgage Type
FHA
Purchase Details
Closed on
Sep 25, 2007
Sold by
Sapphire Lakes Development Llc
Bought by
Jim Giguere Builders Inc
Home Financials for this Owner
Home Financials are based on the most recent Mortgage that was taken out on this home.
Original Mortgage
$1,500,000
Interest Rate
6.55%
Mortgage Type
Purchase Money Mortgage
Create a Home Valuation Report for This Property
The Home Valuation Report is an in-depth analysis detailing your home's value as well as a comparison with similar homes in the area
Home Values in the Area
Average Home Value in this Area
Purchase History
| Date | Buyer | Sale Price | Title Company |
|---|---|---|---|
| Mcclendon John H | -- | None Listed On Document | |
| Mcclendon John H | -- | None Listed On Document | |
| Mcclendon John H | $269,870 | First American Title Ins Co | |
| Jim Giguere Builders Inc | -- | Stewart |
Source: Public Records
Mortgage History
| Date | Status | Borrower | Loan Amount |
|---|---|---|---|
| Previous Owner | Mcclendon John H | $264,981 | |
| Previous Owner | Jim Giguere Builders Inc | $1,500,000 |
Source: Public Records
Tax History Compared to Growth
Tax History
| Year | Tax Paid | Tax Assessment Tax Assessment Total Assessment is a certain percentage of the fair market value that is determined by local assessors to be the total taxable value of land and additions on the property. | Land | Improvement |
|---|---|---|---|---|
| 2025 | $6,089 | $186,200 | $45,000 | $141,200 |
| 2024 | $27 | $177,700 | $42,500 | $135,200 |
| 2023 | $5,649 | $144,000 | $42,000 | $102,000 |
| 2022 | $5,473 | $140,400 | $40,000 | $100,400 |
| 2021 | $5,366 | $134,000 | $36,200 | $97,800 |
| 2020 | $5,201 | $128,700 | $36,200 | $92,500 |
| 2019 | $5,083 | $115,100 | $32,800 | $82,300 |
| 2018 | $4,824 | $104,400 | $35,600 | $68,800 |
| 2017 | $4,588 | $105,500 | $34,900 | $70,600 |
| 2016 | $2,047 | $104,500 | $37,000 | $67,500 |
| 2015 | $2,047 | $95,900 | $58,500 | $37,400 |
| 2014 | $2,047 | $90,600 | $53,900 | $36,700 |
Source: Public Records
Map
Nearby Homes
- 2343 Sapphire Ln Unit 48
- 5167 Sapphire Cir Unit 25
- 5159 Sapphire Cir Unit 27
- 5162 Sapphire Cir Unit 31
- 5283 E Hidden Lake Dr Unit 47
- 5403 Jo Pass
- 5359 Wild Oak Dr Unit 54
- 2545 Koala Dr
- 5403 Wild Oak Dr
- 2216 Iroquois Rd
- 2374 N Wild Blossom Ct
- 2462 Burcham Dr
- 2617 Greencliff Dr
- 5420 Park Lake Rd
- 5120 Wardcliff Dr
- 5435 Blue Haven Dr
- 4793 Ottawa Dr
- 2248 Kenmore Dr
- 4789 Ardmore Ave
- 2162 Kent St
- 2312 Sapphire Ln Unit 6
- 2304 Sapphire Ln Unit 4
- 2300 Sapphire Ln Unit 3
- 2316 Sapphire Ln Unit 7
- 2320 Sapphire Ln
- 2340 Sapphire Ln Unit 13
- 2344 Sapphire Ln Unit 14
- 2311 Sapphire Ln Unit 19
- 2313 Sapphire Ln Unit 20
- 2324 Sapphire Ln Unit 9
- 2315 Sapphire Ln Unit 21
- 2364 Sapphire Ln Unit 1
- 2348 Sapphire Ln
- 2336 Sapphire Ln Unit 12
- 2317 Sapphire Ln
- 2328 Sapphire Ln Unit 10
- 2352 Sapphire Ln Unit 16
- 2360 Sapphire Ln
- 2356 Sapphire Ln Unit 17