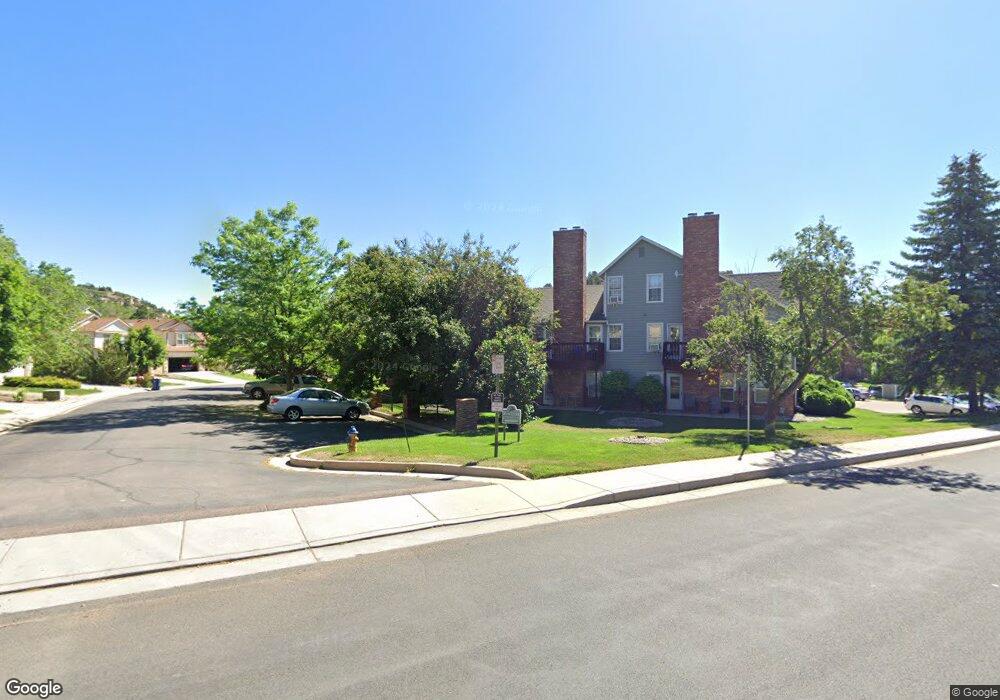
2308 Troy Ct Unit 2308 Colorado Springs, CO 80918
Garden Ranch NeighborhoodEstimated Value: $235,000 - $257,000
2
Beds
2
Baths
930
Sq Ft
$265/Sq Ft
Est. Value
About This Home
This home is located at 2308 Troy Ct Unit 2308, Colorado Springs, CO 80918 and is currently estimated at $246,653, approximately $265 per square foot. 2308 Troy Ct Unit 2308 is a home located in El Paso County with nearby schools including Audubon Elementary School, Mann Middle School, and Coronado High School.
Ownership History
Date
Name
Owned For
Owner Type
Purchase Details
Closed on
Apr 15, 2010
Sold by
Smith Doris Jean
Bought by
Hart Timothy John and Hart Meaghan Jean
Current Estimated Value
Home Financials for this Owner
Home Financials are based on the most recent Mortgage that was taken out on this home.
Original Mortgage
$108,498
Outstanding Balance
$74,030
Interest Rate
5.5%
Mortgage Type
FHA
Estimated Equity
$172,623
Purchase Details
Closed on
Apr 28, 1994
Sold by
Mccready William G and Burdi Gina M
Bought by
Smith Doris Jean
Home Financials for this Owner
Home Financials are based on the most recent Mortgage that was taken out on this home.
Original Mortgage
$52,500
Interest Rate
7.71%
Purchase Details
Closed on
Jul 15, 1993
Bought by
Hart Timothy John
Purchase Details
Closed on
Sep 13, 1989
Bought by
Hart Timothy John
Purchase Details
Closed on
Sep 1, 1985
Bought by
Hart Timothy John
Create a Home Valuation Report for This Property
The Home Valuation Report is an in-depth analysis detailing your home's value as well as a comparison with similar homes in the area
Home Values in the Area
Average Home Value in this Area
Purchase History
| Date | Buyer | Sale Price | Title Company |
|---|---|---|---|
| Hart Timothy John | $110,500 | Heritage Title | |
| Smith Doris Jean | $70,000 | Land Title | |
| Hart Timothy John | $48,000 | -- | |
| Hart Timothy John | -- | -- | |
| Hart Timothy John | -- | -- |
Source: Public Records
Mortgage History
| Date | Status | Borrower | Loan Amount |
|---|---|---|---|
| Open | Hart Timothy John | $108,498 | |
| Previous Owner | Smith Doris Jean | $52,500 |
Source: Public Records
Tax History Compared to Growth
Tax History
| Year | Tax Paid | Tax Assessment Tax Assessment Total Assessment is a certain percentage of the fair market value that is determined by local assessors to be the total taxable value of land and additions on the property. | Land | Improvement |
|---|---|---|---|---|
| 2025 | $658 | $16,760 | -- | -- |
| 2024 | $552 | $16,210 | $3,580 | $12,630 |
| 2023 | $552 | $16,210 | $3,580 | $12,630 |
| 2022 | $751 | $13,420 | $2,500 | $10,920 |
| 2021 | $814 | $13,800 | $2,570 | $11,230 |
| 2020 | $711 | $10,480 | $1,500 | $8,980 |
| 2019 | $707 | $10,480 | $1,500 | $8,980 |
| 2018 | $619 | $8,440 | $1,370 | $7,070 |
| 2017 | $587 | $8,440 | $1,370 | $7,070 |
| 2016 | $463 | $7,980 | $1,190 | $6,790 |
| 2015 | $461 | $7,980 | $1,190 | $6,790 |
| 2014 | $536 | $8,910 | $1,190 | $7,720 |
Source: Public Records
Map
Nearby Homes
- 2328 Troy Ct Unit 2328
- 2022 Palm Dr
- 2355 Troy Ct
- 2028 Palm Dr
- 2131 Troy Ct Unit 2131
- 2310 Royal Palm Dr
- 2039 Palm Dr
- 2140 Palm Dr
- 4410 Campus Bluffs Ct
- 2430 Blazek Loop
- 4295 Ridgecrest Dr
- 1826 Palm Dr
- 2175 Wake Forest Ct
- 2195 Wake Forest Ct
- 2252 Conservatory Point
- 4140 Anitra Cir
- 2520 Hamlet Ln Unit A
- 4876 Saint Augustine Ct
- 3565 Masters Dr
- 1614 Westmoreland Rd
- 2310 Troy Ct
- 2332 Troy Ct Unit 2332
- 2330 Troy Ct Unit 2330
- 2306 Troy Ct Unit 2306
- 2326 Troy Ct Unit 2326
- 2312 Troy Ct Unit 2312
- 2304 Troy Ct Unit 2304
- 2336 Troy Ct Unit 2336
- 2314 Troy Ct Unit 2314
- 2334 Troy Ct Unit 2334
- 2324 Troy Ct Unit 2324
- 2316 Troy Ct Unit 2316
- 2318 Troy Ct Unit 2318
- 2338 Troy Ct Unit 2338
- 2395 Troy Ct
- 2320 Troy Ct
- 2322 Troy Ct Unit 2322
- 2385 Troy Ct
- 2340 Troy Ct Unit 2340
- 2375 Troy Ct