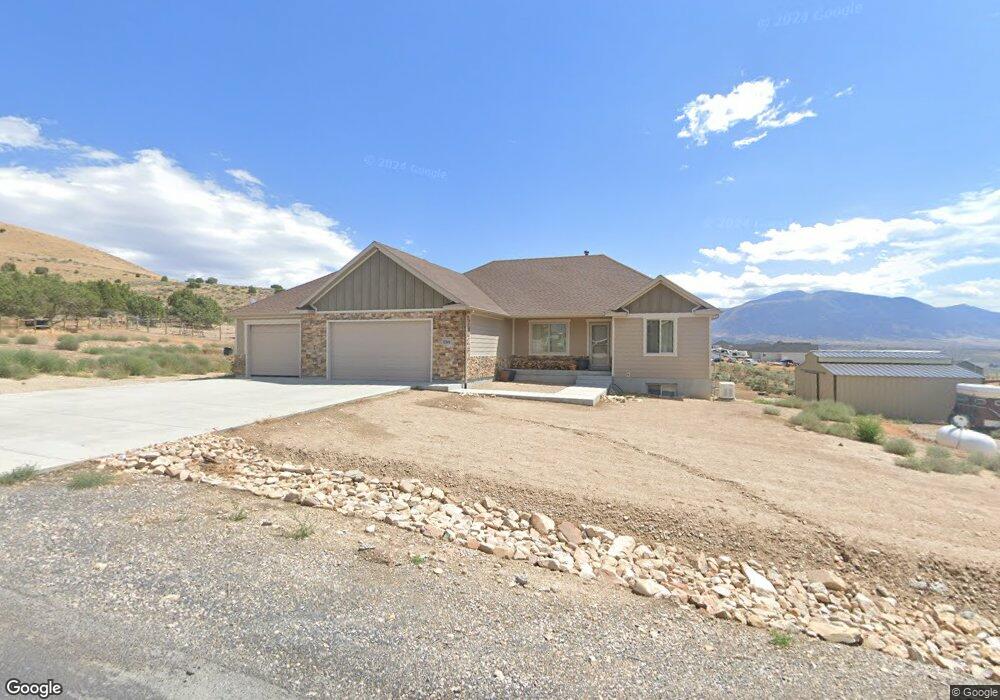
2308 W Cedarline Loop Stockton, UT 84071
Estimated Value: $615,000 - $759,000
--
Bed
--
Bath
3,137
Sq Ft
$210/Sq Ft
Est. Value
About This Home
This home is located at 2308 W Cedarline Loop, Stockton, UT 84071 and is currently estimated at $659,065, approximately $210 per square foot. 2308 W Cedarline Loop is a home with nearby schools including Dugway and Settlement Canyon Elementary School.
Ownership History
Date
Name
Owned For
Owner Type
Purchase Details
Closed on
Jan 26, 2022
Sold by
Mountain Vista Development Inc
Bought by
Bingham Colby
Current Estimated Value
Purchase Details
Closed on
Jun 16, 2021
Sold by
Rankin Robin and Rankin Jeanne
Bought by
Rankin Robin K and Rankin Jeanne M
Purchase Details
Closed on
Oct 24, 2016
Sold by
Gtm Builder Inc
Bought by
Rankin Robin and Rankin Jeanne
Home Financials for this Owner
Home Financials are based on the most recent Mortgage that was taken out on this home.
Original Mortgage
$146,850
Interest Rate
3.5%
Mortgage Type
New Conventional
Purchase Details
Closed on
Jul 19, 2016
Sold by
L & B Development Company Inc
Bought by
Gtm Builder Inc
Home Financials for this Owner
Home Financials are based on the most recent Mortgage that was taken out on this home.
Original Mortgage
$487,500
Interest Rate
3.54%
Mortgage Type
Construction
Create a Home Valuation Report for This Property
The Home Valuation Report is an in-depth analysis detailing your home's value as well as a comparison with similar homes in the area
Home Values in the Area
Average Home Value in this Area
Purchase History
| Date | Buyer | Sale Price | Title Company |
|---|---|---|---|
| Bingham Colby | -- | Sutherland Title | |
| Rankin Robin K | -- | None Available | |
| Rankin Robin | -- | Tooele Title Company | |
| Gtm Builder Inc | -- | Security Title Insurance Age |
Source: Public Records
Mortgage History
| Date | Status | Borrower | Loan Amount |
|---|---|---|---|
| Previous Owner | Rankin Robin | $146,850 | |
| Previous Owner | Gtm Builder Inc | $487,500 |
Source: Public Records
Tax History Compared to Growth
Tax History
| Year | Tax Paid | Tax Assessment Tax Assessment Total Assessment is a certain percentage of the fair market value that is determined by local assessors to be the total taxable value of land and additions on the property. | Land | Improvement |
|---|---|---|---|---|
| 2025 | $3,689 | $576,997 | $205,000 | $371,997 |
| 2024 | $4,237 | $353,596 | $133,500 | $220,096 |
| 2023 | $4,237 | $336,320 | $133,500 | $202,820 |
| 2022 | $3,694 | $352,544 | $115,000 | $237,544 |
| 2021 | $3,045 | $240,602 | $53,250 | $187,352 |
| 2020 | $2,950 | $381,768 | $80,000 | $301,768 |
| 2019 | $2,661 | $340,376 | $70,000 | $270,376 |
| 2018 | $2,623 | $315,796 | $70,000 | $245,796 |
| 2017 | $2,356 | $304,091 | $70,000 | $234,091 |
| 2016 | $324 | $60,000 | $60,000 | $0 |
| 2015 | $324 | $25,000 | $0 | $0 |
| 2014 | -- | $25,000 | $0 | $0 |
Source: Public Records
Map
Nearby Homes
- 2258 W Deer Run Dr Unit 174
- 2138 W Deer Run Dr
- 2692 W Rim Rock Dr Unit 910
- 603 S Cactus Rose
- 2869 W Rim Rock Dr
- 2912 W Rim Rock Dr
- 2974 W Ridgeline Rd Unit 85
- 1472 S Hogans Rd
- 25 W Pearson
- 129 S Grant St
- 1703 Copper St Unit 1277
- 1729 Copper St Unit 1284
- 1731 Copper St Unit 1285
- 4768 E Hickman Canyon Rd
- 0 E Bald Mountain Rd
- 475 Utah 36
- 879 Sundown Ln
- 954 S 1050 W
- 970 W Shallow Dr Unit 131
- 844 S Newmark Dr
- 2268 W Cedarline Loop
- 2222 W Ridgeline Rd Unit 413
- 2222 W Ridgeline Rd
- 2328 W Cedarline Loop Unit 416
- 2339 W Cedarline Loop
- 2188 W Ridgeline Rd Unit 412
- 2352 W Cedarline Loop Unit 417
- 2188 W Ridgeline Rd Unit 412
- 2369 W Cedarline Loop Unit 431
- 2369 W Cedarline Loop Unit 431
- 2271 W Ridgeline Rd Unit 445
- 2227 W Ridgeline Rd Unit 444
- 2156 W Ridgeline Rd
- 2156 W Ridgeline Rd Unit 411
- 2372 W Cedarline Loop Unit 418
- 2309 W Ridgeline Rd Unit 446
- 2309 W Ridgeline Rd Unit 456
- 2203 W Ridgeline Rd Unit 443
- 2364 W Ridgeline Rd Unit 434
- 2364 W Ridgeline Rd