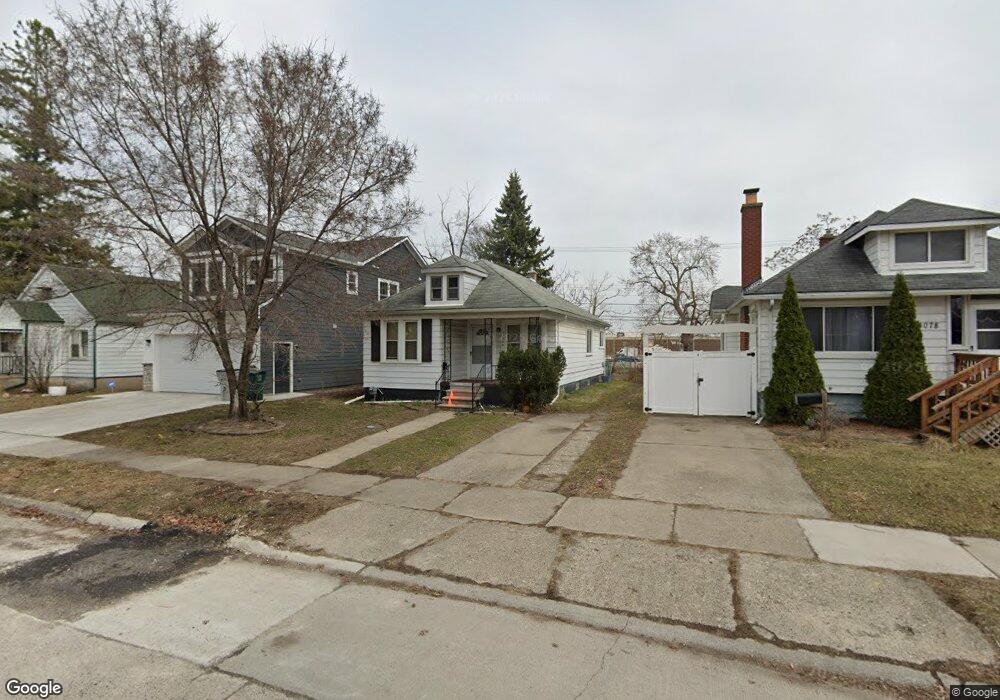
23084 Berdeno Ave Unit Bldg-Unit Hazel Park, MI 48030
Estimated Value: $170,880 - $229,000
3
Beds
1
Bath
1,194
Sq Ft
$160/Sq Ft
Est. Value
About This Home
This home is located at 23084 Berdeno Ave Unit Bldg-Unit, Hazel Park, MI 48030 and is currently estimated at $190,720, approximately $159 per square foot. 23084 Berdeno Ave Unit Bldg-Unit is a home located in Oakland County with nearby schools including Hazel Park Junior High School and Hazel Park High School.
Ownership History
Date
Name
Owned For
Owner Type
Purchase Details
Closed on
Oct 27, 2017
Sold by
Larchwood Properties Llc
Bought by
Huber Stephen
Current Estimated Value
Home Financials for this Owner
Home Financials are based on the most recent Mortgage that was taken out on this home.
Original Mortgage
$53,213
Outstanding Balance
$44,566
Interest Rate
3.83%
Mortgage Type
New Conventional
Estimated Equity
$146,154
Purchase Details
Closed on
Mar 20, 2012
Sold by
Teague Sharon S
Bought by
Federal Home Loan Mortgage Corp
Purchase Details
Closed on
Oct 31, 2005
Sold by
Richardson Doris and Richardson Shella L
Bought by
Teague Sharon S
Create a Home Valuation Report for This Property
The Home Valuation Report is an in-depth analysis detailing your home's value as well as a comparison with similar homes in the area
Home Values in the Area
Average Home Value in this Area
Purchase History
| Date | Buyer | Sale Price | Title Company |
|---|---|---|---|
| Huber Stephen | $70,950 | None Available | |
| Federal Home Loan Mortgage Corp | $61,468 | None Available | |
| Teague Sharon S | $82,000 | First American Title Ins Co |
Source: Public Records
Mortgage History
| Date | Status | Borrower | Loan Amount |
|---|---|---|---|
| Open | Huber Stephen | $53,213 |
Source: Public Records
Tax History Compared to Growth
Tax History
| Year | Tax Paid | Tax Assessment Tax Assessment Total Assessment is a certain percentage of the fair market value that is determined by local assessors to be the total taxable value of land and additions on the property. | Land | Improvement |
|---|---|---|---|---|
| 2024 | $2,773 | $50,820 | $0 | $0 |
| 2023 | $2,797 | $44,170 | $0 | $0 |
| 2022 | $2,776 | $38,180 | $0 | $0 |
| 2021 | $2,722 | $33,140 | $0 | $0 |
| 2020 | $2,664 | $29,900 | $0 | $0 |
| 2019 | $2,687 | $26,650 | $0 | $0 |
| 2018 | $2,624 | $25,170 | $0 | $0 |
| 2017 | $1,959 | $23,630 | $0 | $0 |
| 2016 | $1,956 | $20,610 | $0 | $0 |
| 2015 | -- | $19,330 | $0 | $0 |
| 2014 | -- | $17,990 | $0 | $0 |
| 2011 | -- | $24,640 | $0 | $0 |
Source: Public Records
Map
Nearby Homes
- 23060 Berdeno Ave
- 23304 Stauber Ave
- 23067 Stauber Ave
- 516 Orchard Ave
- 2043 Pilgrim St
- 1909 E Troy St
- 1942 E Troy St
- 138 W Robert Ave
- 2146 Martin Rd
- 1873 Academy St
- 2120 Wrenson St
- 1803 Ardmore Dr
- 345 E Goulson Ave
- 444 S Felker Ave
- 23136 Battelle Ave
- 2105 Manatee St
- 1971 Leitch Rd
- 408 W Jarvis Ave
- 23831 John R Rd
- 1900 College St
- 23084 Berdeno Ave
- 23092 Berdeno Ave
- 23078 Berdeno Ave
- 23100 Berdeno Ave
- 23068 Berdeno Ave
- 23060 Berdeno Ave Unit Bldg-Unit
- 23099 Berdeno Ave
- 23108 Berdeno Ave
- 23052 Berdeno Ave
- 23083 Berdeno Ave
- 23075 Berdeno Ave
- 23067 Berdeno Ave
- 23107 Berdeno Ave
- 23130 Berdeno Ave
- 23059 Berdeno Ave
- 23044 Berdeno Ave
- 23115 Berdeno Ave
- 23132 Berdeno Ave
- 23045 Berdeno Ave
- 23233 S Chrysler Dr Unit Bldg-Unit