Estimated Value: $561,000 - $602,000
4
Beds
3
Baths
2,305
Sq Ft
$254/Sq Ft
Est. Value
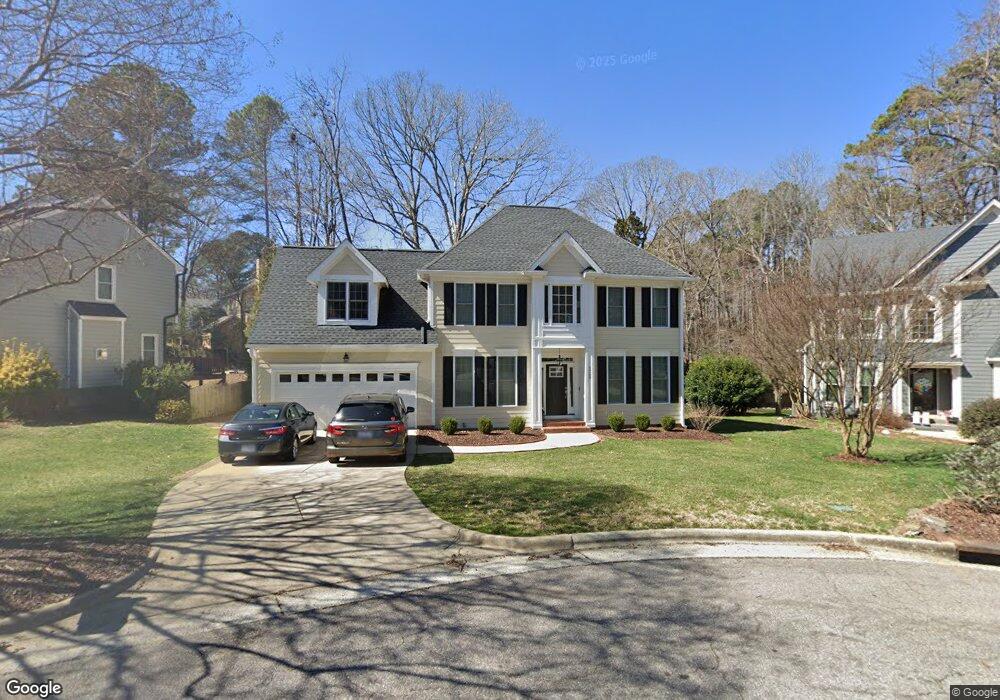
About This Home
This home is located at 2309 Eagles Watch Ct, Apex, NC 27502 and is currently estimated at $585,657, approximately $254 per square foot. 2309 Eagles Watch Ct is a home located in Wake County with nearby schools including Penny Road Elementary School, Apex Middle, and Apex High School.
Ownership History
Date
Name
Owned For
Owner Type
Purchase Details
Closed on
Dec 11, 2024
Sold by
Canning Gregory R and Canning Cristina L
Bought by
Hurst Brian and Hurst Erin
Current Estimated Value
Home Financials for this Owner
Home Financials are based on the most recent Mortgage that was taken out on this home.
Original Mortgage
$435,000
Outstanding Balance
$431,532
Interest Rate
6.72%
Mortgage Type
New Conventional
Estimated Equity
$154,125
Purchase Details
Closed on
Sep 18, 1998
Sold by
Caggiano Anthony
Bought by
Pandya Dhiren and Pandya Shaila
Home Financials for this Owner
Home Financials are based on the most recent Mortgage that was taken out on this home.
Original Mortgage
$167,040
Interest Rate
6.95%
Create a Home Valuation Report for This Property
The Home Valuation Report is an in-depth analysis detailing your home's value as well as a comparison with similar homes in the area
Purchase History
| Date | Buyer | Sale Price | Title Company |
|---|---|---|---|
| Hurst Brian | $620,000 | None Listed On Document | |
| Hurst Brian | $620,000 | None Listed On Document | |
| Pandya Dhiren | $209,000 | -- |
Source: Public Records
Mortgage History
| Date | Status | Borrower | Loan Amount |
|---|---|---|---|
| Open | Hurst Brian | $435,000 | |
| Closed | Hurst Brian | $435,000 | |
| Previous Owner | Pandya Dhiren | $167,040 |
Source: Public Records
Tax History
| Year | Tax Paid | Tax Assessment Tax Assessment Total Assessment is a certain percentage of the fair market value that is determined by local assessors to be the total taxable value of land and additions on the property. | Land | Improvement |
|---|---|---|---|---|
| 2025 | $4,736 | $540,126 | $180,000 | $360,126 |
| 2024 | $4,630 | $540,126 | $180,000 | $360,126 |
Source: Public Records
Map
Nearby Homes
- 2003 Chedington Dr
- 1209 Waterford Green Dr
- 178 Briarfield Dr
- 124 Briarfield Dr
- 1004 Surry Dale Ct
- 1016 Regency Cottage Place
- 609 Angelica Cir
- 644 Angelica Cir
- 2365 Englemann Dr Unit Lot 129
- 3123 June Lake Station Unit Lot 215
- 2361 Englemann Dr
- 2374 Englemann Dr
- 2369 Englemann Dr Unit Lot 130
- 2374 Englemann Dr Unit Lot 105
- 2361 Englemann Dr Unit Lot 131
- 2350 Englemann Dr Unit Lot 99
- 2365 Englemann Dr
- 2354 Englemann Dr Unit Lot 100
- 2354 Englemann Dr
- 2357 Englemann Dr Unit Lot 132
- 2307 Eagles Watch Ct
- 2311 Eagles Watch Ct
- 2216 Winpost Ln
- 2313 Eagles Watch Ct
- 2218 Winpost Ln
- 2305 Eagles Watch Ct
- 2214 Winpost Ln
- 2308 Eagles Watch Ct
- 2310 Eagles Watch Ct
- 2312 Eagles Watch Ct
- 2306 Eagles Watch Ct
- 2314 Eagles Watch Ct
- 2301 Eagles Watch Ct
- 2220 Winpost Ln
- 2304 Eagles Watch Ct
- 2212 Watersglen Dr
- 2210 Watersglen Dr
- 2208 Watersglen Dr
- 2217 Winpost Ln
- 2215 Winpost Ln
Your Personal Tour Guide
Ask me questions while you tour the home.