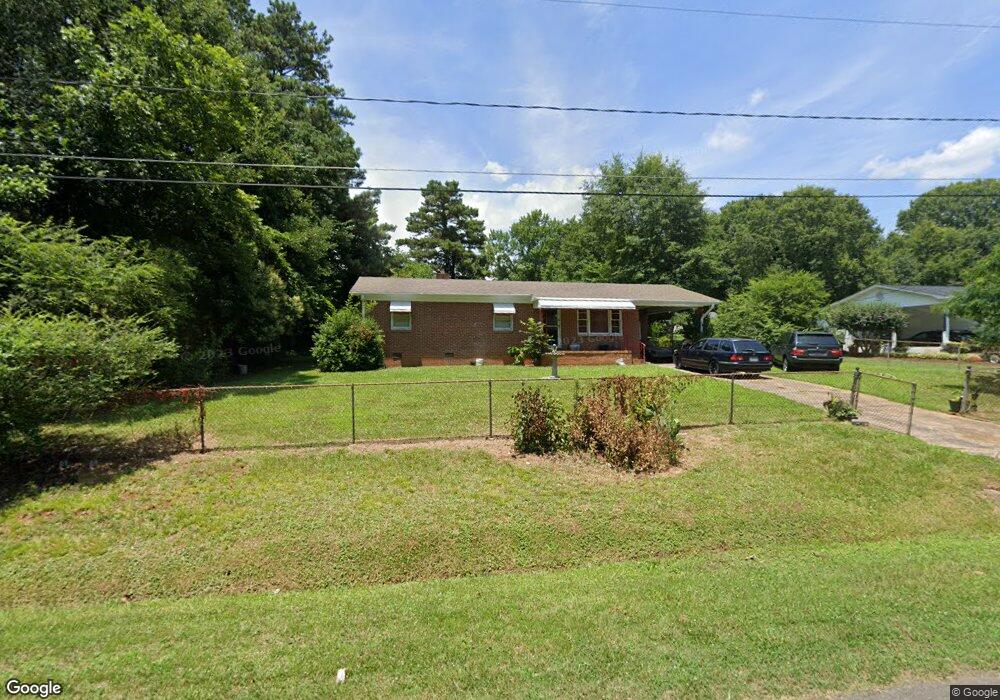
2309 Eleanor Dr Shelby, NC 28150
Estimated Value: $140,143 - $226,000
--
Bed
--
Bath
1,050
Sq Ft
$184/Sq Ft
Est. Value
About This Home
This home is located at 2309 Eleanor Dr, Shelby, NC 28150 and is currently estimated at $192,786, approximately $183 per square foot. 2309 Eleanor Dr is a home located in Cleveland County with nearby schools including Marion Intermediate School, Shelby Middle School, and Shelby High School.
Ownership History
Date
Name
Owned For
Owner Type
Purchase Details
Closed on
Jan 30, 2025
Sold by
Borders David
Bought by
Borders David and Borders David Leon
Current Estimated Value
Purchase Details
Closed on
Jan 7, 2011
Sold by
Borders Leonard and Borders Elizabeth
Bought by
Borders David L
Purchase Details
Closed on
Jun 16, 2010
Sold by
Washington Sr Ronald J and Washington Jr Ronald J
Bought by
Borders Leonard
Create a Home Valuation Report for This Property
The Home Valuation Report is an in-depth analysis detailing your home's value as well as a comparison with similar homes in the area
Home Values in the Area
Average Home Value in this Area
Purchase History
| Date | Buyer | Sale Price | Title Company |
|---|---|---|---|
| Borders David | -- | None Listed On Document | |
| Borders David | -- | None Listed On Document | |
| Borders David L | -- | None Available | |
| Borders Leonard | $31,000 | None Available |
Source: Public Records
Tax History Compared to Growth
Tax History
| Year | Tax Paid | Tax Assessment Tax Assessment Total Assessment is a certain percentage of the fair market value that is determined by local assessors to be the total taxable value of land and additions on the property. | Land | Improvement |
|---|---|---|---|---|
| 2025 | $522 | $127,143 | $13,875 | $113,268 |
| 2024 | $201 | $60,203 | $6,660 | $53,543 |
| 2023 | $557 | $60,203 | $6,660 | $53,543 |
| 2022 | $556 | $60,203 | $6,660 | $53,543 |
| 2021 | $557 | $60,203 | $6,660 | $53,543 |
| 2020 | $472 | $48,091 | $6,660 | $41,431 |
| 2019 | $472 | $48,091 | $6,660 | $41,431 |
| 2018 | $467 | $48,091 | $6,660 | $41,431 |
| 2017 | $465 | $48,091 | $6,660 | $41,431 |
| 2016 | $442 | $48,091 | $6,660 | $41,431 |
| 2015 | $518 | $57,666 | $6,660 | $51,006 |
| 2014 | $518 | $57,666 | $6,660 | $51,006 |
Source: Public Records
Map
Nearby Homes
- 2315 Marlowe Ave
- 2314 Marlowe Ave
- 2520 Wildwood Dr
- 403 Murdock Cir
- 1805 Isaac Place
- 2021 Dogwood Trail
- 2016 Dogwood Trail
- 136 Dogwood Ln
- 2060 Stoneview Cir
- 2201 Holly Ln
- 2200 Peninsula Ave
- 313 Kellom Dr
- 1108 Borders Rd
- 2207 Peninsula Ave
- 0 Oates Dr
- 2111 Windermere Ln
- 207 Fairmont Dr
- 505 Mauney Ln
- 320 Country Club Acres None
- 316 Country Club Acres None
- 2311 Eleanor Dr
- 2308 Elizabeth Ave
- 2310 Elizabeth Ave
- 2306 Elizabeth Ave
- 2314 Rowel St
- 2312 Eleanor Dr
- 2304 Elizabeth Ave
- 00 Eleanor Dr
- 0 Eleanor Dr
- 2311 Mason St
- 2401 Eleanor Dr
- 2307 Mason St
- 2302 Elizabeth Ave
- 2400 Eleanor Dr
- 2400 Elizabeth Ave
- 2301 Mason St
- 2405 Eleanor Dr
- 2401 Elizabeth Ave
- 2404 Elizabeth Ave
- 2305 Elizabeth Ave