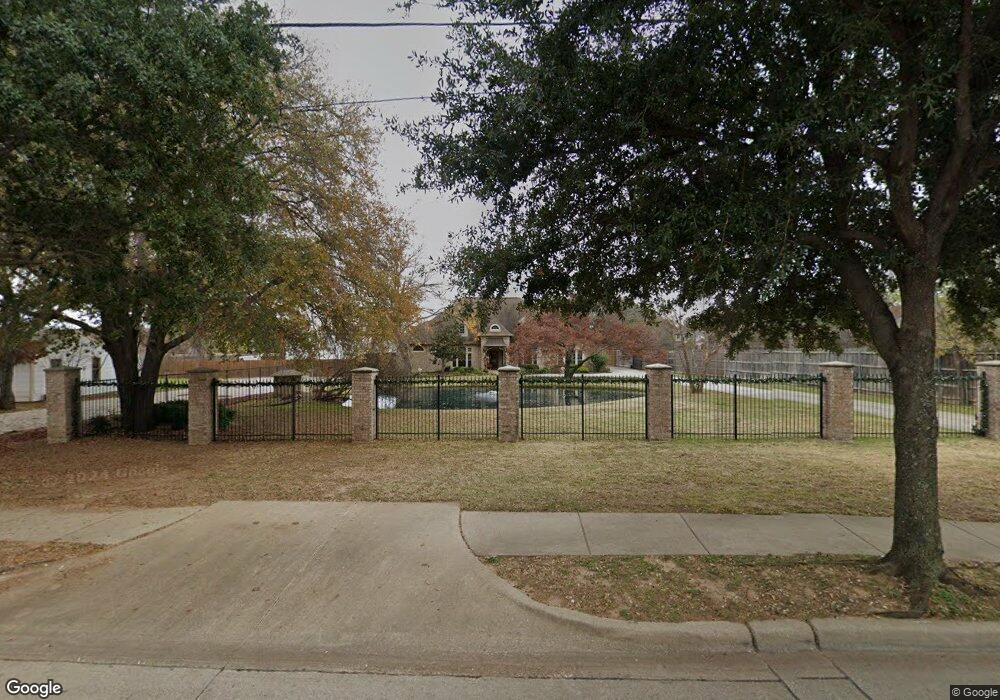
2309 Hall Johnson Rd Colleyville, TX 76034
Estimated Value: $995,749 - $1,714,000
3
Beds
2
Baths
4,252
Sq Ft
$296/Sq Ft
Est. Value
About This Home
This home is located at 2309 Hall Johnson Rd, Colleyville, TX 76034 and is currently estimated at $1,257,187, approximately $295 per square foot. 2309 Hall Johnson Rd is a home located in Tarrant County with nearby schools including O.C. Taylor Elementary School, Colleyville Middle School, and Waypoint Montessori.
Ownership History
Date
Name
Owned For
Owner Type
Purchase Details
Closed on
Aug 21, 2013
Sold by
Dorety Family Lp
Bought by
Jay John and Jay Deborah
Current Estimated Value
Home Financials for this Owner
Home Financials are based on the most recent Mortgage that was taken out on this home.
Original Mortgage
$520,000
Outstanding Balance
$387,680
Interest Rate
4.53%
Mortgage Type
Purchase Money Mortgage
Estimated Equity
$869,507
Purchase Details
Closed on
Jun 7, 2013
Sold by
Dorety John R and Dorety Elizabeth Louise
Bought by
Dorety Family Lp
Purchase Details
Closed on
Oct 12, 2004
Sold by
Mikolaitis John J and Mikolaitis Deborah K
Bought by
Dorety John R and Dorety Elizabeth Louise
Purchase Details
Closed on
Oct 5, 2001
Sold by
Chandler Cantrell Properties
Bought by
Mikolaitis John J and Mikolaitis Deborah K
Home Financials for this Owner
Home Financials are based on the most recent Mortgage that was taken out on this home.
Original Mortgage
$85,000
Interest Rate
6.84%
Create a Home Valuation Report for This Property
The Home Valuation Report is an in-depth analysis detailing your home's value as well as a comparison with similar homes in the area
Home Values in the Area
Average Home Value in this Area
Purchase History
| Date | Buyer | Sale Price | Title Company |
|---|---|---|---|
| Jay John | -- | None Available | |
| Dorety Family Lp | -- | None Available | |
| Dorety John R | -- | American Title | |
| Mikolaitis John J | -- | Alamo Title Company |
Source: Public Records
Mortgage History
| Date | Status | Borrower | Loan Amount |
|---|---|---|---|
| Open | Jay John | $520,000 | |
| Previous Owner | Mikolaitis John J | $85,000 |
Source: Public Records
Tax History Compared to Growth
Tax History
| Year | Tax Paid | Tax Assessment Tax Assessment Total Assessment is a certain percentage of the fair market value that is determined by local assessors to be the total taxable value of land and additions on the property. | Land | Improvement |
|---|---|---|---|---|
| 2025 | $2,623 | $703,407 | $319,345 | $384,062 |
| 2024 | $2,623 | $703,407 | $319,345 | $384,062 |
| 2023 | $13,444 | $1,063,283 | $319,345 | $743,938 |
| 2022 | $14,310 | $724,555 | $319,345 | $405,210 |
| 2021 | $15,059 | $687,720 | $288,690 | $399,030 |
| 2020 | $13,853 | $623,404 | $288,690 | $334,714 |
| 2019 | $14,965 | $664,381 | $288,690 | $375,691 |
| 2018 | $3,498 | $588,435 | $288,690 | $299,745 |
| 2017 | $12,638 | $642,604 | $288,690 | $353,914 |
| 2016 | $11,489 | $564,732 | $285,690 | $279,042 |
| 2015 | $10,047 | $442,100 | $96,230 | $345,870 |
| 2014 | $10,047 | $442,100 | $96,230 | $345,870 |
Source: Public Records
Map
Nearby Homes
- 5504 Sycamore Dr
- 5613 Versailles Ct
- 5404 Miramar Ln
- 5508 Coventry Ct
- 1813 Grosvenor Green
- 2906 Cottonwood Ln
- 4214 Hearthside Dr
- 3216 Glade Rd
- 4213 Hearthside Dr
- Lot 4 Amelia Ct
- 2906 Edgewood Ln
- 3329 Moss Creek Dr
- 2008 Kyle Ct
- 4282 Hearthside Dr
- 2602 Pointe Ct
- 2618 Pointe Ct
- 3321 Circlewood Ct
- 5317 Bluebonnet Dr
- 1512 Four Seasons Dr
- 4723 Bill Simmons Rd
- 5701 Sycamore Dr
- 5705 Sycamore Dr
- 2313 Hall Johnson Rd
- 2313 Hall Johnson Rd
- 5709 Sycamore Dr
- 5609 Sycamore Dr
- 2317 Hall Johnson Rd
- 5605 Sycamore Dr
- 2305 Ballantrae Dr
- 2303 Ballantrae Dr
- 2307 Ballantrae Dr
- 5704 Sycamore Dr
- 5708 Sycamore Dr
- 5680 Amador Trail
- 2301 Ballantrae Dr
- 2308 Mulberry Ct
- 5603 Sycamore Dr
- 2309 Ballantrae Dr
- 2207 Ballantrae Dr
- 5606 Amador Trail