Estimated Value: $118,420 - $164,000
--
Bed
1
Bath
1,188
Sq Ft
$121/Sq Ft
Est. Value
About This Home
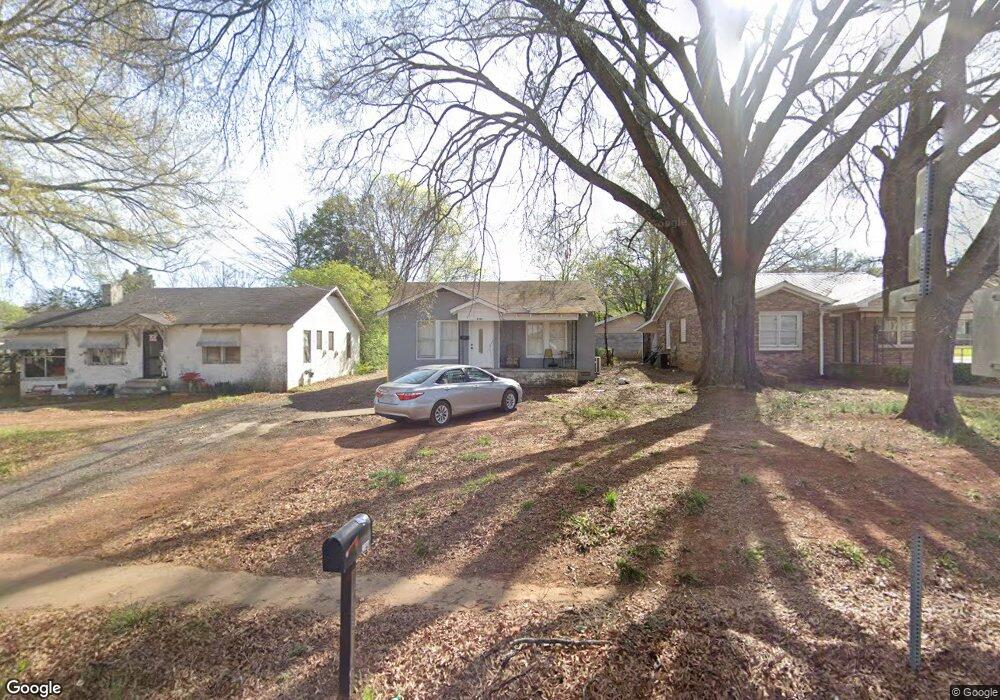
This home is located at 2309 Maple Rd SE, Rome, GA 30161 and is currently estimated at $143,605, approximately $120 per square foot. 2309 Maple Rd SE is a home located in Floyd County with nearby schools including Pepperell Middle School, Pepperell High School, and Montessori School of Rome.
Ownership History
Date
Name
Owned For
Owner Type
Purchase Details
Closed on
Jan 18, 2022
Sold by
Busby Danny L
Bought by
Redden Steven
Current Estimated Value
Home Financials for this Owner
Home Financials are based on the most recent Mortgage that was taken out on this home.
Original Mortgage
$38,800
Outstanding Balance
$30,672
Interest Rate
2.62%
Mortgage Type
Cash
Estimated Equity
$112,933
Purchase Details
Closed on
Oct 15, 2013
Sold by
Sargent Susan
Bought by
Busby Danny L
Purchase Details
Closed on
Aug 31, 1998
Sold by
Cargle Morris
Bought by
Sargent Susan
Purchase Details
Closed on
Aug 21, 1989
Sold by
P\R P\R P\R
Bought by
Cargle Morris
Purchase Details
Closed on
Feb 15, 1964
Sold by
Harbour Mary Elizabeth A Harbour Mary
Bought by
P\R P\R P\R
Purchase Details
Closed on
Oct 11, 1955
Sold by
Harbour John H Harbour John H Harbour
Bought by
Harbour Mary Elizabeth A Harbour Ma
Purchase Details
Closed on
Jan 1, 1901
Bought by
Harbour John H Harbour John H Harbo
Create a Home Valuation Report for This Property
The Home Valuation Report is an in-depth analysis detailing your home's value as well as a comparison with similar homes in the area
Home Values in the Area
Average Home Value in this Area
Purchase History
| Date | Buyer | Sale Price | Title Company |
|---|---|---|---|
| Redden Steven | $40,000 | -- | |
| Busby Danny L | -- | -- | |
| Sargent Susan | $25,000 | -- | |
| Cargle Morris | $25,000 | -- | |
| P\R P\R P\R | -- | -- | |
| Harbour Mary Elizabeth A Harbour Ma | -- | -- | |
| Harbour John H Harbour John H Harbo | -- | -- |
Source: Public Records
Mortgage History
| Date | Status | Borrower | Loan Amount |
|---|---|---|---|
| Open | Redden Steven | $38,800 |
Source: Public Records
Tax History Compared to Growth
Tax History
| Year | Tax Paid | Tax Assessment Tax Assessment Total Assessment is a certain percentage of the fair market value that is determined by local assessors to be the total taxable value of land and additions on the property. | Land | Improvement |
|---|---|---|---|---|
| 2024 | $1,578 | $46,494 | $2,548 | $43,946 |
| 2023 | $1,330 | $44,948 | $2,184 | $42,764 |
| 2022 | $603 | $20,336 | $1,820 | $18,516 |
| 2021 | $549 | $18,173 | $1,820 | $16,353 |
| 2020 | $864 | $28,374 | $1,456 | $26,918 |
| 2019 | $729 | $24,270 | $1,456 | $22,814 |
| 2018 | $678 | $22,541 | $1,456 | $21,085 |
| 2017 | $648 | $21,485 | $1,456 | $20,029 |
| 2016 | $675 | $22,116 | $1,440 | $20,676 |
| 2015 | $660 | $22,116 | $1,440 | $20,676 |
| 2014 | $660 | $22,116 | $1,440 | $20,676 |
Source: Public Records
Map
Nearby Homes
- 107 E Linden St SE
- 2108 Maple Ave SW
- 7 Willingham St SW
- 2501 Maple Rd SE
- 2508 Maple Rd SE
- 0 Martha Berry Hwy Unit 7525627
- 0 Martha Berry Hwy Unit 7614774
- 0 Martha Berry Hwy Unit 10563404
- 2014 Maple Ave SW
- 14 Clover St SW
- 2523 Maple Rd SE
- 111 Hosea St SW
- 304 E 19th St SW
- 211 Alfred Ave SE
- 2107 Rockmart Rd SE
- 212 Alfred Ave SE
- 1901 Hull Ave SW
- 226 Flora Ave SE
- 2710 Maple Rd SE
- 2311 Maple Rd SE
- 2307 Maple Rd SE
- 101 E Juniper Way SE
- 2305 Maple Rd SE
- 2401 Maple Rd SE
- 103 E Juniper Way SE
- 6 Lombardy Way SE
- 2301 Maple Rd SE
- 102 E Juniper Way SE
- 105 E Juniper Way SE
- 2403 Maple Rd SE
- 2312 Maple Rd SE
- 2306 Maple Rd SE
- 8 Lombardy Way SE
- 2400 Maple Rd SE
- 104 E Juniper Way SE
- E Juniper Way SE
- 2304 Maple Rd SE
- 2405 Maple Rd SE
- 107 E Juniper Way SE