Estimated Value: $433,000 - $449,132
--
Bed
3
Baths
3,168
Sq Ft
$139/Sq Ft
Est. Value
About This Home
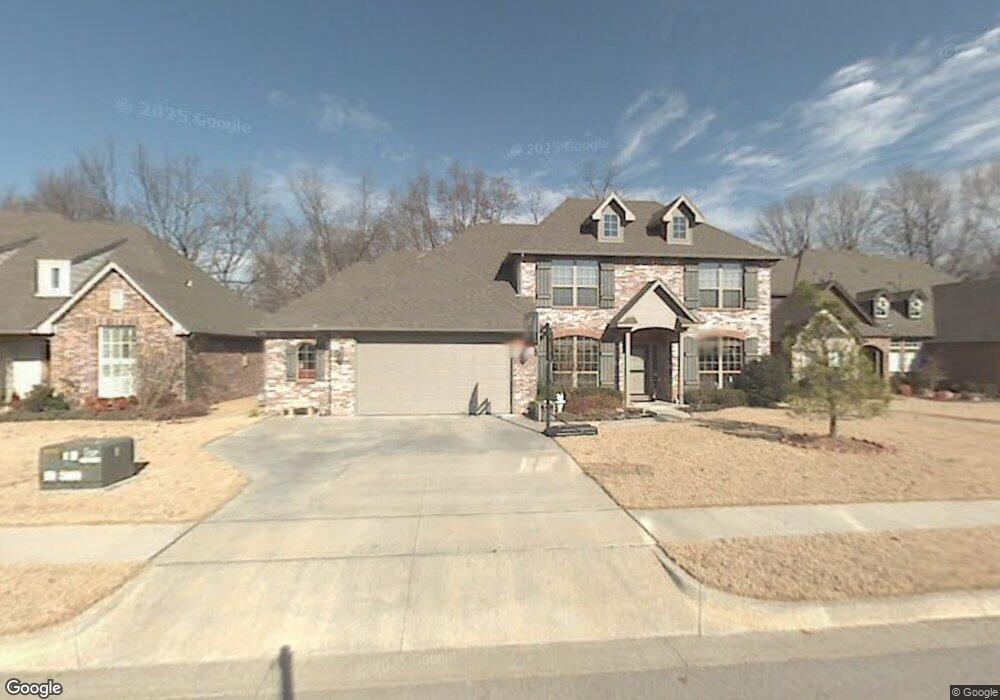
This home is located at 2309 W E St, Jenks, OK 74037 and is currently estimated at $439,783, approximately $138 per square foot. 2309 W E St is a home located in Tulsa County with nearby schools including Jenks West Elementary School, Jenks West Intermediate Elementary School, and Jenks Middle School.
Ownership History
Date
Name
Owned For
Owner Type
Purchase Details
Closed on
Aug 26, 2014
Sold by
Wilson Gregory M and Wilson Brenda J
Bought by
Jones Matthew C and Jones Tracy J
Current Estimated Value
Home Financials for this Owner
Home Financials are based on the most recent Mortgage that was taken out on this home.
Original Mortgage
$255,510
Outstanding Balance
$195,826
Interest Rate
4.17%
Mortgage Type
New Conventional
Estimated Equity
$243,957
Purchase Details
Closed on
Jun 25, 2008
Sold by
Webb K Douglas and Webb Dee
Bought by
Wilson Gregory M and Wilson Brenda J
Home Financials for this Owner
Home Financials are based on the most recent Mortgage that was taken out on this home.
Original Mortgage
$217,600
Interest Rate
5.99%
Mortgage Type
Purchase Money Mortgage
Purchase Details
Closed on
Jul 16, 2004
Sold by
Palmer Douglas R and Palmer Lynda K
Bought by
Webb K Douglas and Webb Dee
Create a Home Valuation Report for This Property
The Home Valuation Report is an in-depth analysis detailing your home's value as well as a comparison with similar homes in the area
Home Values in the Area
Average Home Value in this Area
Purchase History
| Date | Buyer | Sale Price | Title Company |
|---|---|---|---|
| Jones Matthew C | $284,000 | Tulsa Abstract & Title Co | |
| Wilson Gregory M | $272,000 | Firstitle & Abstract Service | |
| Webb K Douglas | $250,500 | -- |
Source: Public Records
Mortgage History
| Date | Status | Borrower | Loan Amount |
|---|---|---|---|
| Open | Jones Matthew C | $255,510 | |
| Previous Owner | Wilson Gregory M | $217,600 |
Source: Public Records
Tax History Compared to Growth
Tax History
| Year | Tax Paid | Tax Assessment Tax Assessment Total Assessment is a certain percentage of the fair market value that is determined by local assessors to be the total taxable value of land and additions on the property. | Land | Improvement |
|---|---|---|---|---|
| 2024 | $4,128 | $33,427 | $3,163 | $30,264 |
| 2023 | $4,128 | $33,424 | $3,428 | $29,996 |
| 2022 | $4,043 | $31,450 | $4,030 | $27,420 |
| 2021 | $3,972 | $30,505 | $3,909 | $26,596 |
| 2020 | $3,885 | $30,505 | $3,909 | $26,596 |
| 2019 | $3,911 | $30,505 | $3,909 | $26,596 |
| 2018 | $3,904 | $30,240 | $3,908 | $26,332 |
| 2017 | $3,840 | $31,240 | $4,037 | $27,203 |
| 2016 | $3,934 | $31,240 | $4,037 | $27,203 |
| 2015 | $4,009 | $31,240 | $4,037 | $27,203 |
| 2014 | $3,921 | $29,920 | $4,037 | $25,883 |
Source: Public Records
Map
Nearby Homes
- 2412 W D St
- 2105 W F Ct
- 508 N Willow St
- 2102 W F Ct
- 2428 W C St
- 9402 S Elwood
- 9340 S Elwood Ave
- 9726 S Houston Ave
- 507 N Emerson St
- 2040 E 129th Place S
- 1410 W 91st St
- 908 W 86th Place S
- 8732 S Quanah Ave
- 1107 W 86th Place S
- 922 W 86th St S
- 1114 W 86th St S
- 1105 W 86th St S
- 912 W 85th St
- 8723 S Phoenix Place W
- 905 W 85th St