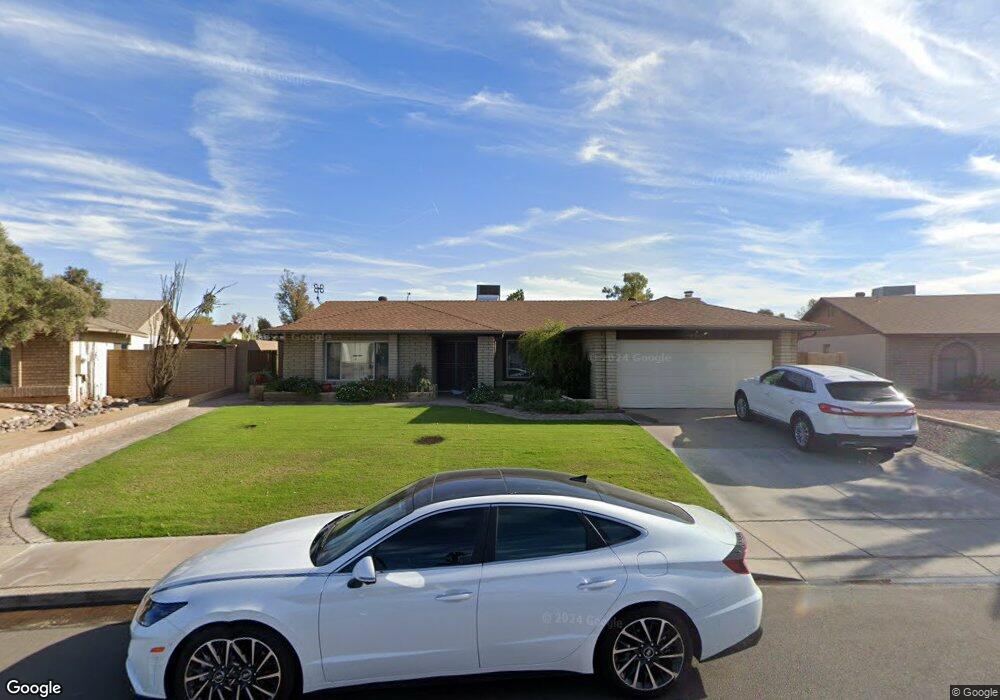
2309 W El Alba Way Chandler, AZ 85224
Central Ridge NeighborhoodEstimated Value: $466,343 - $599,000
--
Bed
2
Baths
2,054
Sq Ft
$262/Sq Ft
Est. Value
About This Home
This home is located at 2309 W El Alba Way, Chandler, AZ 85224 and is currently estimated at $539,086, approximately $262 per square foot. 2309 W El Alba Way is a home located in Maricopa County with nearby schools including Pomeroy Elementary School, Franklin at Brimhall Elementary School, and Summit Academy Elementary.
Ownership History
Date
Name
Owned For
Owner Type
Purchase Details
Closed on
Oct 9, 2020
Sold by
Manning Jeffrey H
Bought by
Manning Jeffrey H
Current Estimated Value
Home Financials for this Owner
Home Financials are based on the most recent Mortgage that was taken out on this home.
Original Mortgage
$229,000
Outstanding Balance
$203,683
Interest Rate
2.9%
Mortgage Type
New Conventional
Estimated Equity
$335,403
Purchase Details
Closed on
Oct 2, 2008
Sold by
Manning Jeffrey H
Bought by
Manning Jeffrey H and The Jeffrey H Manning Trust
Purchase Details
Closed on
Nov 16, 2005
Sold by
Wiggins Robert and Wiggins Lavonne
Bought by
Manning Jeffrey H
Home Financials for this Owner
Home Financials are based on the most recent Mortgage that was taken out on this home.
Original Mortgage
$259,920
Interest Rate
5.87%
Mortgage Type
Purchase Money Mortgage
Create a Home Valuation Report for This Property
The Home Valuation Report is an in-depth analysis detailing your home's value as well as a comparison with similar homes in the area
Home Values in the Area
Average Home Value in this Area
Purchase History
| Date | Buyer | Sale Price | Title Company |
|---|---|---|---|
| Manning Jeffrey H | -- | Elevated Title | |
| Manning Jeffrey H | -- | None Available | |
| Manning Jeffrey H | $324,900 | First American Title Ins Co |
Source: Public Records
Mortgage History
| Date | Status | Borrower | Loan Amount |
|---|---|---|---|
| Open | Manning Jeffrey H | $229,000 | |
| Closed | Manning Jeffrey H | $259,920 |
Source: Public Records
Tax History Compared to Growth
Tax History
| Year | Tax Paid | Tax Assessment Tax Assessment Total Assessment is a certain percentage of the fair market value that is determined by local assessors to be the total taxable value of land and additions on the property. | Land | Improvement |
|---|---|---|---|---|
| 2025 | $1,890 | $22,162 | -- | -- |
| 2024 | $1,908 | $21,107 | -- | -- |
| 2023 | $1,908 | $39,510 | $7,900 | $31,610 |
| 2022 | $1,856 | $29,600 | $5,920 | $23,680 |
| 2021 | $1,866 | $27,430 | $5,480 | $21,950 |
| 2020 | $1,845 | $25,530 | $5,100 | $20,430 |
| 2019 | $1,699 | $23,810 | $4,760 | $19,050 |
| 2018 | $1,650 | $22,150 | $4,430 | $17,720 |
| 2017 | $1,587 | $20,820 | $4,160 | $16,660 |
| 2016 | $1,552 | $20,510 | $4,100 | $16,410 |
| 2015 | $1,461 | $18,310 | $3,660 | $14,650 |
Source: Public Records
Map
Nearby Homes
- 2210 N Los Altos Dr
- 2103 W Palomino Dr
- 2431 W Los Arboles Place
- 2552 N Ellis St
- 2029 W Shawnee Dr
- 2050 N 90th Place
- 2100 W Lemon Tree Place Unit 68
- 2100 W Lemon Tree Place Unit 29
- 2100 W Lemon Tree Place Unit 78
- 1771 W Mariposa Ct
- 2337 W Cheyenne Dr
- 2702 W Brooks St
- 2674 N El Dorado Dr
- 2129 N Villas Ln
- 2663 W Estrella Dr
- 2015 N Villas Ln
- 2221 W Rockwell Dr
- 1821 W Mission Dr
- 1962 N Blackstone Dr
- 2615 N Yucca St
- 2307 W El Alba Way
- 2311 W El Alba Way
- 2208 N Los Altos Dr
- 2206 N Los Altos Dr
- 2313 W El Alba Way
- 2305 W El Alba Way
- 2310 W El Alba Way
- 2212 N Los Altos Dr
- 2312 W El Alba Way
- 2204 N Los Altos Dr
- 2214 N Los Altos Dr
- 2308 W El Alba Way
- 2315 W El Alba Way
- 2314 W El Alba Way
- 2303 W El Alba Way
- 2216 N Los Altos Dr
- 2301 N Tamarisk Ct
- 2214 W El Prado Rd
- 2317 W Al Alba Way
- 2207 N Los Altos Dr