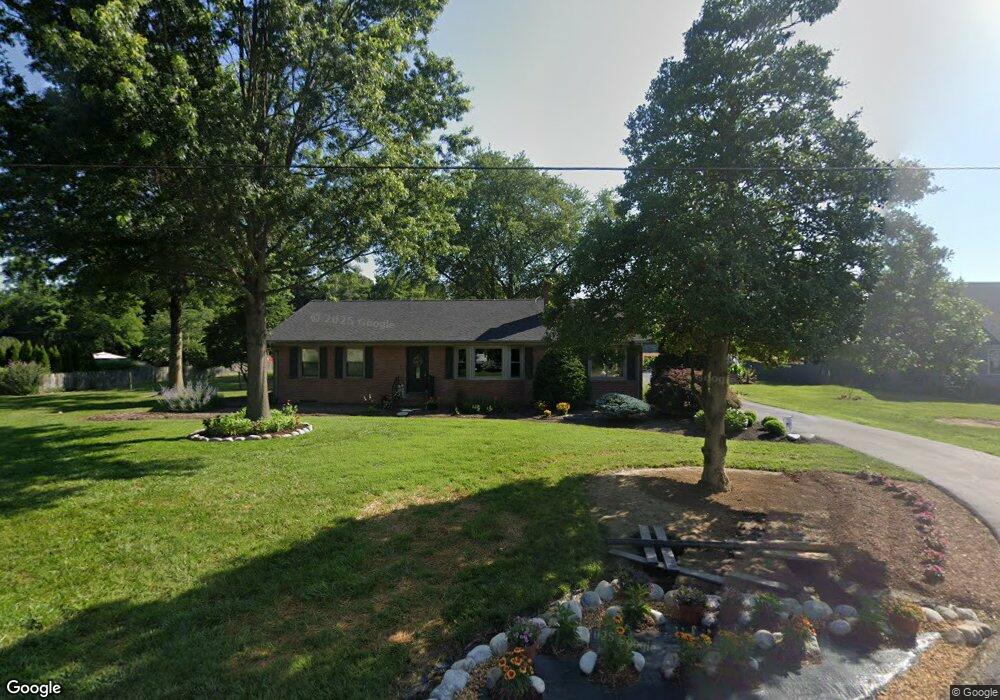
23098 Raleigh Rd Chestertown, MD 21620
Estimated Value: $338,000 - $506,000
--
Bed
1
Bath
1,728
Sq Ft
$231/Sq Ft
Est. Value
About This Home
This home is located at 23098 Raleigh Rd, Chestertown, MD 21620 and is currently estimated at $399,229, approximately $231 per square foot. 23098 Raleigh Rd is a home located in Kent County with nearby schools including Center for Innovation, Kent County Middle School, and Kent County High School.
Ownership History
Date
Name
Owned For
Owner Type
Purchase Details
Closed on
Jul 10, 2024
Sold by
Cole Ronald Keith and Cole Gladys Beth
Bought by
Bayside Holding Company Llc
Current Estimated Value
Purchase Details
Closed on
Dec 14, 2007
Sold by
Osborn Gladys Beth
Bought by
Cole Ronald and Gladys Beth
Home Financials for this Owner
Home Financials are based on the most recent Mortgage that was taken out on this home.
Original Mortgage
$215,000
Interest Rate
6.48%
Mortgage Type
Stand Alone Second
Purchase Details
Closed on
Nov 13, 2007
Sold by
Osborn Gladys Beth
Bought by
Cole Ronald and Gladys Beth
Home Financials for this Owner
Home Financials are based on the most recent Mortgage that was taken out on this home.
Original Mortgage
$215,000
Interest Rate
6.48%
Mortgage Type
Stand Alone Second
Purchase Details
Closed on
Feb 18, 2004
Sold by
Raleigh Hilda
Bought by
Osborn Gladys Beth
Purchase Details
Closed on
Sep 13, 1978
Sold by
Raleigh Charles Albert
Bought by
Raleigh Hilda
Create a Home Valuation Report for This Property
The Home Valuation Report is an in-depth analysis detailing your home's value as well as a comparison with similar homes in the area
Home Values in the Area
Average Home Value in this Area
Purchase History
| Date | Buyer | Sale Price | Title Company |
|---|---|---|---|
| Bayside Holding Company Llc | $365,000 | Chicago Title | |
| Bayside Holding Company Llc | $365,000 | Chicago Title | |
| Cole Ronald | -- | -- | |
| Cole Ronald | -- | -- | |
| Osborn Gladys Beth | $181,100 | -- | |
| Raleigh Hilda | $3,500 | -- |
Source: Public Records
Mortgage History
| Date | Status | Borrower | Loan Amount |
|---|---|---|---|
| Previous Owner | Cole Ronald | $215,000 | |
| Previous Owner | Cole Ronald | $215,000 |
Source: Public Records
Tax History Compared to Growth
Tax History
| Year | Tax Paid | Tax Assessment Tax Assessment Total Assessment is a certain percentage of the fair market value that is determined by local assessors to be the total taxable value of land and additions on the property. | Land | Improvement |
|---|---|---|---|---|
| 2025 | $2,894 | $255,200 | $0 | $0 |
| 2024 | $2,354 | $207,600 | $70,300 | $137,300 |
| 2023 | $2,196 | $201,467 | $0 | $0 |
| 2022 | $2,196 | $195,333 | $0 | $0 |
| 2021 | $2,132 | $189,200 | $70,300 | $118,900 |
| 2020 | $2,132 | $188,000 | $0 | $0 |
| 2019 | $2,118 | $186,800 | $0 | $0 |
| 2018 | $2,105 | $185,600 | $70,300 | $115,300 |
| 2017 | $2,105 | $185,600 | $0 | $0 |
| 2016 | -- | $185,600 | $0 | $0 |
| 2015 | $2,180 | $187,400 | $0 | $0 |
| 2014 | $2,180 | $187,400 | $0 | $0 |
Source: Public Records
Map
Nearby Homes
- 23069 Raleigh Rd
- 23043 Bay Shore Spur
- 23110 Old Fairlee Rd
- 0 Fairlee Rd
- 8750 Georgetown Rd
- 0 Rd
- 8833 Georgetown Rd
- 0 Georgetown Rd SE Unit MDKE2005218
- 0 Georgetown Rd SE Unit MDKE2005076
- 0 Georgetown Rd SE Unit MDKE2005844
- 0 Fish Hatchery Rd Unit MDKE2002848
- 0 Fish Hatchery Rd Unit MDKE2004754
- 0 Caulks Field Rd Unit MDKE2002846
- 0 Caulks Field Rd Unit MDKE2005120
- 10121 Fairlee Rd
- 0 Bunting Rd
- 0 Sandpiper Rd Unit MDKE2005542
- 24543 Chestertown Rd
- 0 Melitota Ln
- 23710 L Rd
- 0 Raleigh Rd
- 23112 Raleigh Rd
- 23086 Raleigh Rd
- 23099 Raleigh Rd
- 23087 Raleigh Rd
- 23109 Raleigh Rd
- 23081 Raleigh Rd
- 23118 Raleigh Rd
- 23115 Raleigh Rd
- 23064 Raleigh Rd
- 23130 Raleigh Rd
- 8931 Fairlee Rd
- 23127 Raleigh Rd
- 8968 Ecker Rd
- 8894 Center Ln
- 8887 Center Ln
- 8900 Center Ln
- 8923 Fairlee Rd
- 0 Map 36 Parcel 80 Watertower Rd Unit MDKE2003624
- 23138 Raleigh Rd