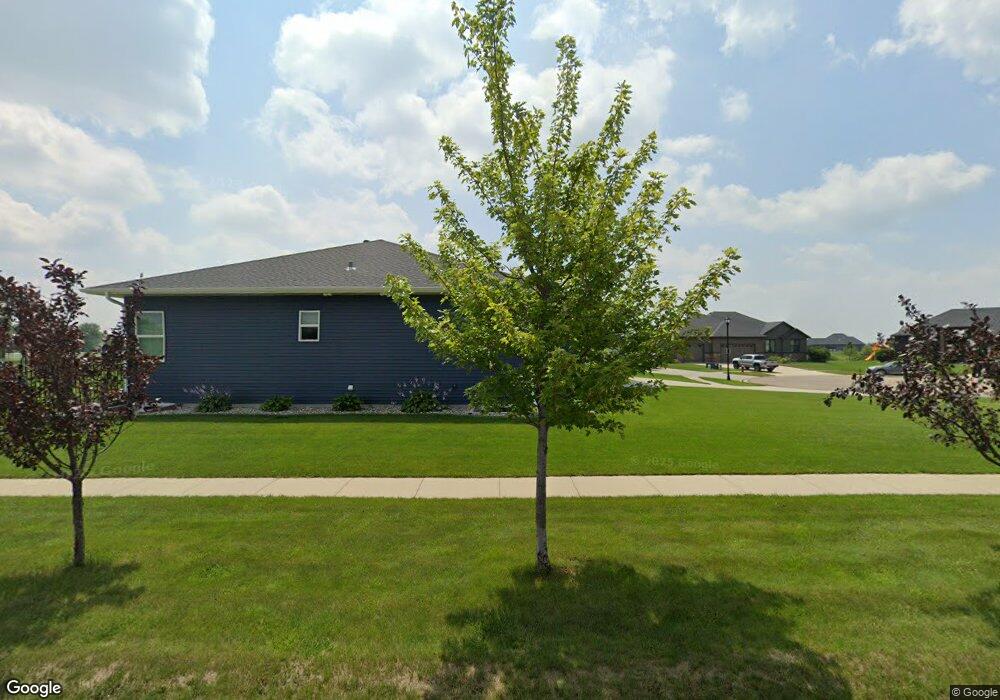
231 47th Ave W West Fargo, ND 58078
The Wilds NeighborhoodEstimated Value: $1,246,857
5
Beds
3
Baths
2,315
Sq Ft
$539/Sq Ft
Est. Value
About This Home
This home is located at 231 47th Ave W, West Fargo, ND 58078 and is currently estimated at $1,246,857, approximately $538 per square foot. 231 47th Ave W is a home located in Cass County with nearby schools including Legacy Elementary School, Liberty Middle School, and West Fargo Sheyenne High School.
Ownership History
Date
Name
Owned For
Owner Type
Purchase Details
Closed on
May 15, 2013
Sold by
Designer Homes Of Fargo Moorhead Llc
Bought by
Sorenson Patrick L and Sorenson Tonya S
Current Estimated Value
Home Financials for this Owner
Home Financials are based on the most recent Mortgage that was taken out on this home.
Original Mortgage
$417,000
Interest Rate
3.52%
Mortgage Type
New Conventional
Purchase Details
Closed on
Dec 28, 2012
Sold by
Westport Investments Llc
Bought by
Designer Homes Of Fargo Moorhead Llc
Home Financials for this Owner
Home Financials are based on the most recent Mortgage that was taken out on this home.
Original Mortgage
$375,000
Interest Rate
3.28%
Mortgage Type
Credit Line Revolving
Create a Home Valuation Report for This Property
The Home Valuation Report is an in-depth analysis detailing your home's value as well as a comparison with similar homes in the area
Home Values in the Area
Average Home Value in this Area
Purchase History
| Date | Buyer | Sale Price | Title Company |
|---|---|---|---|
| Sorenson Patrick L | $617,293 | None Available | |
| Designer Homes Of Fargo Moorhead Llc | -- | Trn Abst And Title |
Source: Public Records
Mortgage History
| Date | Status | Borrower | Loan Amount |
|---|---|---|---|
| Closed | Sorenson Patrick L | $417,000 | |
| Previous Owner | Designer Homes Of Fargo Moorhead Llc | $375,000 |
Source: Public Records
Tax History Compared to Growth
Tax History
| Year | Tax Paid | Tax Assessment Tax Assessment Total Assessment is a certain percentage of the fair market value that is determined by local assessors to be the total taxable value of land and additions on the property. | Land | Improvement |
|---|---|---|---|---|
| 2024 | $16,676 | $458,050 | $86,600 | $371,450 |
| 2023 | $16,501 | $446,750 | $86,600 | $360,150 |
| 2022 | $15,316 | $388,000 | $86,600 | $301,400 |
| 2021 | $15,138 | $369,250 | $79,350 | $289,900 |
| 2020 | $14,810 | $360,750 | $79,350 | $281,400 |
| 2019 | $14,999 | $353,400 | $79,350 | $274,050 |
| 2018 | $15,032 | $362,050 | $79,350 | $282,700 |
| 2017 | $14,888 | $364,500 | $79,350 | $285,150 |
| 2016 | $13,770 | $354,350 | $79,350 | $275,000 |
| 2015 | $12,270 | $265,700 | $62,750 | $202,950 |
| 2014 | $11,965 | $318,400 | $62,750 | $255,650 |
| 2013 | $7,558 | $70,200 | $35,600 | $34,600 |
Source: Public Records
Map
Nearby Homes
- 223 47th Ave W
- 239 47th Ave W
- 247 47th Ave W
- 255 47th Ave W
- 4725 Chokecherry Ct
- 4717 Chokecherry Ct W
- 4717 Chokecherry Ct
- 4724 Chokecherry Ct W
- 4724 Chokecherry Ct
- 4709 Chokecherry Ct W
- 4812 Sheyenne St
- 4703 McMahon Estates Ct
- 4716 Chokecherry Ct
- 4711 McMahon Estates Ct
- 4708 Chokecherry Ct
- 4708 Chokecherry Ct W
- 4522 Sheyenne St
- 4700 McMahon Estates Ct
- 4511 S River Estates Way
- 4773 Lilac Dr