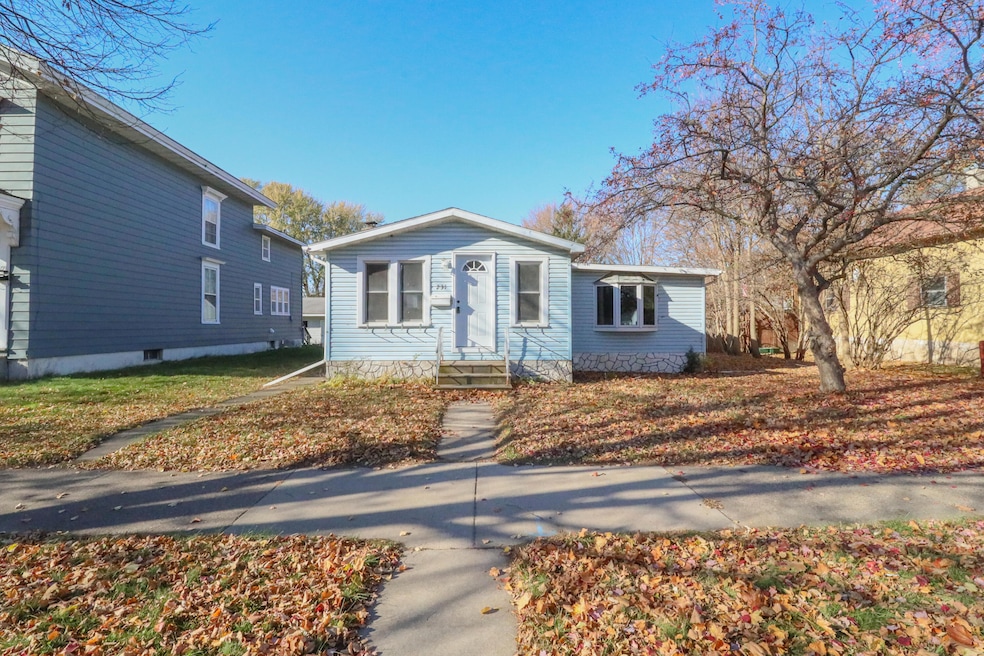
231 Avon St La Crosse, WI 54603
Lower Northside NeighborhoodEstimated payment $963/month
Highlights
- Popular Property
- Ranch Style House
- Forced Air Heating and Cooling System
- Deck
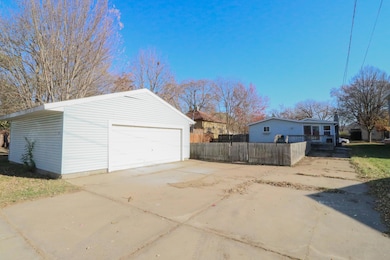
- 2.5 Car Detached Garage
About This Home
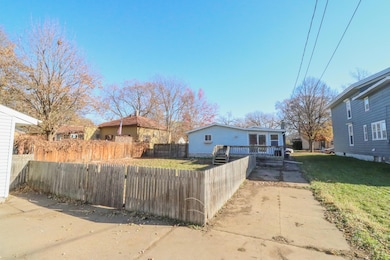
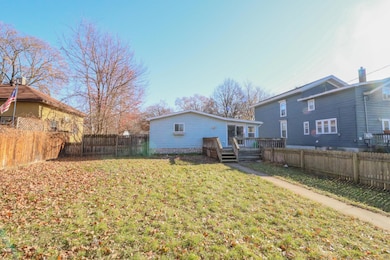
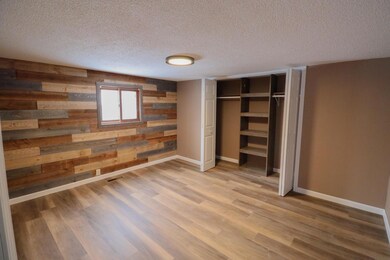
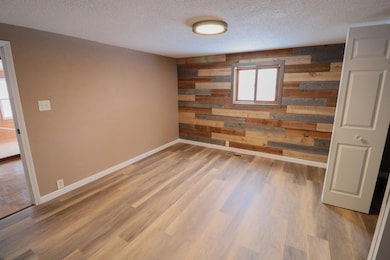
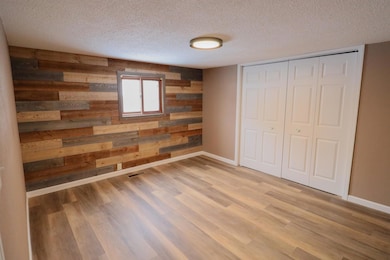
Charming 2-Bedroom Home in a Quiet Neighborhood Welcome home to this cozy 1-story, 2-bedroom, 1-bath property filled with rustic charm and modern updates. Nestled in a quiet neighborhood, this home offers both comfort and convenience. Step inside to enjoy a warm, inviting atmosphere and a beautiful 4-season porch perfect for relaxing year-round. The home features several recent upgrades, including a new furnace and new hot water heater giving you peace of mind for years to come; new flooring including ceramic tile, and completely renovated bathroom. Outside, you'll find a fully fenced backyard, ideal for pets, play, or outdoor entertaining. A spacious 2.5-car detached garage provides ample storage and there's an additional parking pad for an RV or boat.
Home Details
Home Type
- Single Family
Est. Annual Taxes
- $2,422
Lot Details
- 8,712 Sq Ft Lot
- Property fronts an alley
Parking
- 2.5 Car Detached Garage
- Garage Door Opener
Home Design
- Ranch Style House
- Vinyl Siding
Interior Spaces
- 1,163 Sq Ft Home
- Partial Basement
- Washer
Kitchen
- Range
- Microwave
Bedrooms and Bathrooms
- 2 Bedrooms
- 1 Full Bathroom
Outdoor Features
- Deck
Utilities
- Forced Air Heating and Cooling System
- Heating System Uses Natural Gas
Listing and Financial Details
- Exclusions: Seller personal property
- Assessor Parcel Number 017010050070
Map
Home Values in the Area
Average Home Value in this Area
Tax History
| Year | Tax Paid | Tax Assessment Tax Assessment Total Assessment is a certain percentage of the fair market value that is determined by local assessors to be the total taxable value of land and additions on the property. | Land | Improvement |
|---|---|---|---|---|
| 2024 | $2,634 | $113,700 | $14,500 | $99,200 |
| 2023 | $2,243 | $113,700 | $14,500 | $99,200 |
| 2022 | $2,142 | $113,700 | $14,500 | $99,200 |
| 2021 | $2,004 | $81,300 | $14,500 | $66,800 |
| 2020 | $1,809 | $80,200 | $14,500 | $65,700 |
| 2019 | $1,762 | $80,200 | $14,500 | $65,700 |
| 2018 | $2,017 | $78,400 | $14,400 | $64,000 |
| 2017 | $2,068 | $78,400 | $14,400 | $64,000 |
| 2016 | $2,261 | $77,700 | $14,400 | $63,300 |
| 2015 | $2,053 | $77,700 | $14,400 | $63,300 |
| 2014 | $2,039 | $77,700 | $14,400 | $63,300 |
| 2013 | $2,179 | $77,700 | $14,400 | $63,300 |
Property History
| Date | Event | Price | List to Sale | Price per Sq Ft |
|---|---|---|---|---|
| 12/04/2025 12/04/25 | Pending | -- | -- | -- |
| 12/02/2025 12/02/25 | For Sale | $145,000 | -- | $125 / Sq Ft |
Purchase History
| Date | Type | Sale Price | Title Company |
|---|---|---|---|
| Sheriffs Deed | $66,500 | None Listed On Document | |
| Warranty Deed | $110,000 | New Castle Title | |
| Warranty Deed | $82,500 | None Available | |
| Warranty Deed | $85,000 | None Available |
Mortgage History
| Date | Status | Loan Amount | Loan Type |
|---|---|---|---|
| Previous Owner | $3,850 | New Conventional | |
| Previous Owner | $108,007 | New Conventional | |
| Previous Owner | $79,100 | New Conventional |
Source: Metro MLS
MLS Number: 1944301
APN: 017-010050-070
Disclaimer: Certain information contained herein is derived from information provided by parties other than Homes.com. All information provided is deemed reliable, but is not guaranteed to be accurate and should be independently verified.
![]() IDX information is provided exclusively for personal, non-commercial use, and may not be used for any purpose other than to identify prospective properties consumers may be interested in purchasing.
IDX information is provided exclusively for personal, non-commercial use, and may not be used for any purpose other than to identify prospective properties consumers may be interested in purchasing.
IDX listing data provided by Multiple Listing Service, Inc. Information is supplied by seller and other third parties and has not been verified.
Copyright 2025 – Multiple Listing Service, Inc. – All Rights Reserved.
