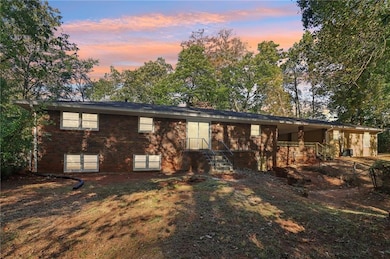
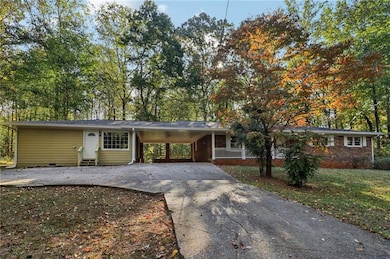
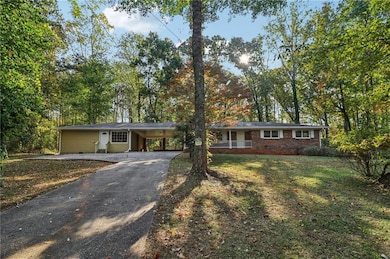
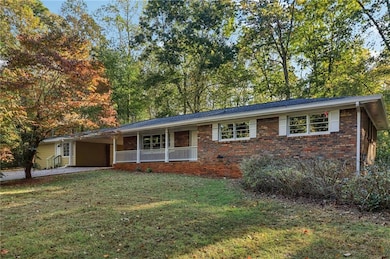
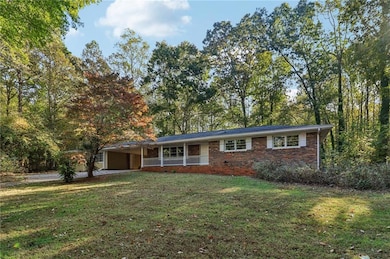
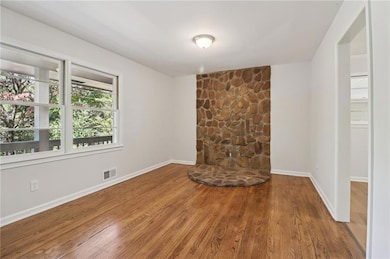
Buy two homes for the price of one! Don't miss this amazing opportunity to get into a recently updated all brick ranch home with an in-law suite or income producing addition. Large nearly one acre lot offers tons of privacy both in the front and backyard. Plenty of parking with driveway and carport. Walk inside to new paint, new fixtures, new flooring, updated kitchen and bathrooms, and much more. Roof replaced in 2025. Very convenient location just minutes to downtown Dallas, Hiram, and Marietta.
Additional Rooms: Family Room, Kitchen, Laundry, Living Room
Dining Room Features: Open Concept
Square Footage: 2109.00
Spa Features: None
Window Features: Double Pane Windows
Beds/Baths
Total Bedrooms: 5
Bedroom Features: Double Master Bedroom, Master on Main, Split Bedroom Plan
Main Bedrooms: 5
Total Bathrooms: 3
Total Full Baths: 3
Main Full Bathrooms: 3
Master Bathroom Features: Shower Only
Exterior Features
Construction Materials: Brick 4 Sides
Roof Type: Composition
Fencing: Chain Link
Patio And Porch Features: Front Porch
Exterior Features: Private Yard
View: Trees/Woods
Pool Private: No
Foundation: Slab
Garage/Parking
Number of Carport Spaces: 2
Parking Features: Carport
Utilities
Sewer: Septic Tank
Water Source: Public
Security: Smoke Detector(s)
Cooling: Ceiling Fan(s), Central Air
Heating: Central
Laundry Features: Laundry Room
Utilities: Cable Available, Electricity Available, Water Available
Electric: Other
Condo/Co-op/Association
Subdivision Complex: J Edwin Brock
Lot Info
Acres: 0.9000
Lot Features: Back Yard, Front Yard
Lot Dimensions: x
Parcel Number: 010134
Horse Amenities: None
Land Lease: No
Property Attached Yn: No
Green Features
Green Energy Generation: None
Tax Info
Taxes: 918.00
Tax Year: 2024
MLS Schools
Elementary School: Dallas
High School: East Paulding
Middle School: P.B. Ritch
Map
Range of Values:
--
Value Increase
--
Percent Increase
--
Adjusted for Inflation
Collateral Analytics
Collateral Analytics
Collateral Analytics AVMs (Automated Valuation Model) employ a number of statistical approaches combined with neighborhood-specific comparable selection guarantees the most up-to-date and precise valuations.
Not Available
Collateral Analytics does not have data for the current month. Please view the chart for historical values.
ICE
ICE Mortgage Technology
ICE Mortgage Technology’s AVM (Automated Valuation Model) is a state-of-the-art online residential property valuation tool that provides a quick and accurate estimate of the value of almost any home in the U.S.
Not Available
ICE Mortgage Technology does not have data for the current month. Please view the chart for historical values.
First American
First American
First American Data & Analytics’ next-generation AVM combines unrivaled data assets with a blended ensemble of valuation models to produce highly accurate, reliable valuations you can trust.
Not Available
First American does not have data for the current month. Please view the chart for historical values.
Quantarium
Quantarium
Quantarium’s valuation service, repeatedly proven the industry’s most accurate and comprehensive, is supercharged with a self-learning and auto-tuning AI engine that continually becomes smarter and more accurate as it processes daily inputs from the industry’s leading RE data lake.
Not Available
Quantarium does not have data for the current month. Please view the chart for historical values.
Average Value
Not Available
List Price
Sold Price
Create a Home Valuation Report for This Property
The Home Valuation Report is an in-depth analysis detailing your home's value as well as a comparison with similar homes in the area
Home Values in the Area
Source: Public Records
Average Home Value in this Area
Source: Public Records
Tax History
Year
Tax Paid
Tax AssessmentTax Assessment
Total Assessment is a certain percentage of the fair market value that is determined by local assessors to be the total taxable value of land and additions on the property.
I was born and raised in West Georgia, currently living in the Dallas/Acworth area, and have been a Realtor and Residential sales agent for nearly 10 years. As a second generation Realtor in the Metro Atlanta area, I am acutely aware that Real Estate transactions can be an intimidating venture. Buying and Selling a home is one of the most important financial decisions an individual, or family can make. Whether a first time home buyer, first time seller, or investor that has been involved in
Insane deal on this massive home in a beautiful neighborhood, and super convenient Paulding County location. The interior of this one is much larger than the exterior would indicate. Walk inside to a welcoming 2-story foyer, leading to a very functional and family friendly main level. Complete with large dining room, open concept kitchen and family room, walk in pantry, half bath, and more.
Move in ready all brick ranch home in convenient Douglasville location. Exterior features an oversized driveway with extra parking, covered carport, and huge fenced in backyard complete with backyard storage building. Walk inside to a recently updated interior with new flooring, paint, appliances, fixtures, and more. Family friendly three bedroom, and two full bath floorplan. Full laundry room on
Move in ready ranch home with tons of recent updates! Exterior features a large lot, with brand new deck overlooking private back yard. Inside is a spacious one level floorplan with large rooms, and a bright feel. New paint, flooring, appliances, fixtures, and much more. Great location, just minutes to schools, shopping, and Interstate 20.
It is a joy to present this incredible, one owner homestead on 2.5+/- acres. Viewing this beautiful property takes some time and is so much fun! Curb appeal abounds with a circular driveway, and tons of poured concrete offering abundant parking space for vehicles, trailers, campers, boats, etc. Warm covered, rocking chair front porch, columns and stone exterior with a wide stone staircase leading
Move right into this 3-level townhome located just minutes to Canton, Woodstock, Interstate 575, and Lake Allatoona. Enjoy parking in the attached one car garage, and driveway. Sip your coffee in the mornings either on the covered front porch, or open rear deck. Walk inside to a main level featuring an entrance foyer, half bath for guests, and open family room, dining, and kitchen area. Solid
Welcome home to a move in ready, one level all brick ranch home. Spacious one acre level lot with plenty of room for vehicles, swimming pool, barns, and much more. Walk inside to new flooring, new paint, new appliances, new fixtures, and updated kitchen and bath. Amazing location convenient to both Villa Rica, Carrollton, shopping, schools, and so much more.
Rare, 4-sided brick ranch home in sought after Bridgemill S/D! Great corner lot with side driveway, and circular front driveway. Walk inside to a move in ready, one, level ranch featuring a very functional floorplan, tons of daylight, and 3 bedrooms on main level. Split bedroom plan with master on one side, and additional bedrooms on the other. Two living spaces to allow for multiple gathering
Proud to present this newly listed, newly updated and remolded ranch home. Purchase with peace of mind: New roof, New luxury vinyl and carpet flooring inside, New windows, New stainless appliances (dishwasher, microwave, range, and refrigerator), New cabinets, New granite counter tops, New vanities and fixtures, New tub in secondary bath, and New blinds throughout. Exterior features a spacious
Don't miss this beautiful, large, ranch home with recent renovations! Move right in and enjoy all this beauty has to offer. Great location, just minutes from downtown Rome. Tons of recent updates, including new siding, new room, new paint, new LVP flooring, new fixtures, new countertops, new appliances, and much more. Spacious lot, with long driveway, and front and back yard.
Disclaimer: Certain information contained herein is derived from information provided by parties other than Homes.com. All information provided is deemed reliable, but is not guaranteed to be accurate and should be independently verified.