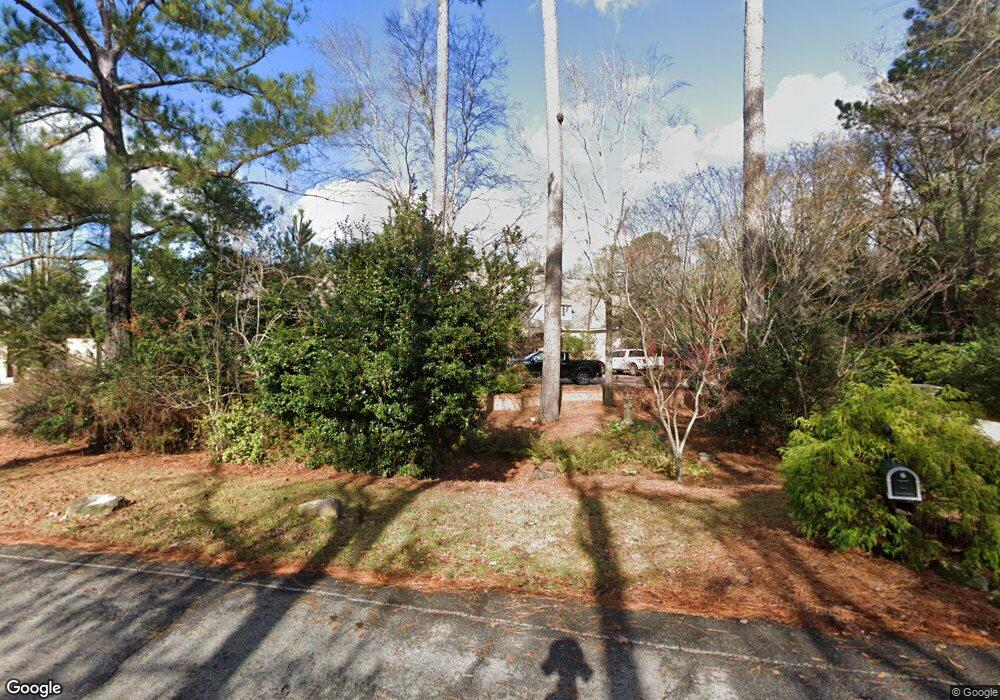
231 Cascade Rd Columbus, GA 31904
North Columbus NeighborhoodEstimated Value: $960,000 - $1,118,000
4
Beds
4
Baths
5,249
Sq Ft
$200/Sq Ft
Est. Value
About This Home
This home is located at 231 Cascade Rd, Columbus, GA 31904 and is currently estimated at $1,048,023, approximately $199 per square foot. 231 Cascade Rd is a home located in Muscogee County with nearby schools including River Road Elementary School, Double Churches Middle School, and Northside High School.
Ownership History
Date
Name
Owned For
Owner Type
Purchase Details
Closed on
Jul 25, 2019
Sold by
Cheek Benjamin H
Bought by
Kersey Cameron and Kersey Leah
Current Estimated Value
Home Financials for this Owner
Home Financials are based on the most recent Mortgage that was taken out on this home.
Original Mortgage
$831,250
Outstanding Balance
$726,894
Interest Rate
3.73%
Estimated Equity
$321,129
Purchase Details
Closed on
Jul 9, 2014
Sold by
Borenstein Mark S
Bought by
Cheek Benjamin H and Cheek Kathryn K
Home Financials for this Owner
Home Financials are based on the most recent Mortgage that was taken out on this home.
Original Mortgage
$629,300
Interest Rate
4.26%
Mortgage Type
New Conventional
Purchase Details
Closed on
Oct 7, 2013
Sold by
Borenstein Denise G
Bought by
Borenstein Mark S
Create a Home Valuation Report for This Property
The Home Valuation Report is an in-depth analysis detailing your home's value as well as a comparison with similar homes in the area
Home Values in the Area
Average Home Value in this Area
Purchase History
| Date | Buyer | Sale Price | Title Company |
|---|---|---|---|
| Kersey Cameron | $875,000 | -- | |
| Cheek Benjamin H | $700,000 | -- | |
| Borenstein Mark S | -- | -- | |
| Borenstein Mark S | -- | -- |
Source: Public Records
Mortgage History
| Date | Status | Borrower | Loan Amount |
|---|---|---|---|
| Open | Kersey Cameron | $831,250 | |
| Previous Owner | Cheek Benjamin H | $629,300 |
Source: Public Records
Tax History
| Year | Tax Paid | Tax Assessment Tax Assessment Total Assessment is a certain percentage of the fair market value that is determined by local assessors to be the total taxable value of land and additions on the property. | Land | Improvement |
|---|---|---|---|---|
| 2025 | $17,011 | $434,556 | $133,640 | $300,916 |
| 2024 | $16,549 | $422,768 | $83,636 | $339,132 |
| 2023 | $16,653 | $422,768 | $83,636 | $339,132 |
| 2022 | $14,227 | $348,440 | $83,636 | $264,804 |
| 2021 | $12,049 | $295,096 | $83,636 | $211,460 |
| 2020 | $12,052 | $295,096 | $83,636 | $211,460 |
| 2019 | $10,925 | $300,588 | $83,636 | $216,952 |
| 2018 | $10,925 | $300,588 | $83,636 | $216,952 |
| 2017 | $10,962 | $300,588 | $83,636 | $216,952 |
| 2016 | $11,003 | $280,000 | $31,811 | $248,189 |
| 2015 | $11,016 | $280,000 | $31,811 | $248,189 |
| 2014 | $6,397 | $399,999 | $31,811 | $368,188 |
| 2013 | -- | $399,999 | $31,811 | $368,188 |
Source: Public Records
Map
Nearby Homes
- 254 Cascade Rd
- 222 Cascade Rd
- 258 Cascade Rd
- 306 Cascade Rd
- 5431 Roaring Branch Rd
- 5472 Roaring Branch Rd
- 6101 River Rd Unit 14
- 6101 River Rd Unit 13
- 6101 River Rd Unit 2
- 407 Grey Moss Cove
- 6400 Green Island Dr Unit 42
- 6400 Green Island Dr Unit 11
- 6400 Green Island Dr Unit 43
- 217 Moss Dr
- 5094 Hale Dr
- 5212 River Rd
- 803 Litchfield Rd
- 804 Lichfield Rd
- 6528 Standing Boy Rd
- 831 53rd St
- 235 Cascade Rd
- 246 Cascade Rd
- 240 Cascade Rd
- 5781 Exeter Ct
- 5785 Exeter Ct
- 137 Cascade Rd
- 5767 Roaring Branch Rd
- 210 Cascade Rd
- 5789 Exeter Ct
- 258 Cascade Rd
- 204 Cascade Rd
- 125 Cascade Rd
- 280 Cascade Rd
- 5749 Roaring Branch Rd
- 313 Cascade Rd
- 105 Cascade Rd
- 5805 Warwick Place
- 5807 Warwick Place
- 5733 Roaring Branch Rd
- 150 Cascade Rd
Your Personal Tour Guide
Ask me questions while you tour the home.