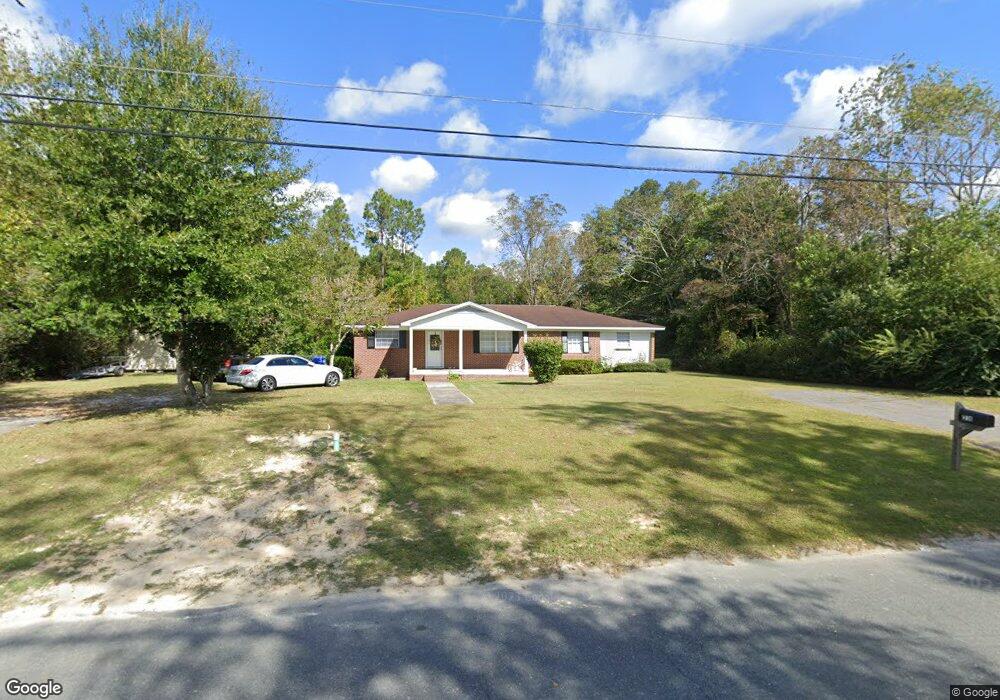
231 Cherokee Ave Waycross, GA 31501
Estimated Value: $136,000 - $164,000
4
Beds
3
Baths
1,790
Sq Ft
$84/Sq Ft
Est. Value
About This Home
This home is located at 231 Cherokee Ave, Waycross, GA 31501 and is currently estimated at $149,825, approximately $83 per square foot. 231 Cherokee Ave is a home located in Ware County with nearby schools including Wacona Elementary School, Ware County Middle School, and Ware County High School.
Ownership History
Date
Name
Owned For
Owner Type
Purchase Details
Closed on
Nov 4, 2016
Bought by
Cornerstone Real Estate Llc
Current Estimated Value
Purchase Details
Closed on
Jul 20, 2016
Sold by
Wilda B
Bought by
Boykin Lita O
Purchase Details
Closed on
Sep 3, 2013
Sold by
Bank Of America
Bought by
Sec Of Housing & Urban
Purchase Details
Closed on
Jun 21, 2004
Sold by
Cox Freddie D
Bought by
Cox Kimberly
Purchase Details
Closed on
Jan 1, 2003
Sold by
Appraisal
Bought by
Appraisal
Purchase Details
Closed on
Oct 15, 1998
Sold by
Groover Joseph and Groover Lar
Bought by
Cox Freddie D
Purchase Details
Closed on
Jan 8, 1997
Sold by
Groover Lonnie Estat
Bought by
Groover Joseph and Groover Lar
Purchase Details
Closed on
Feb 5, 1990
Sold by
Groover Jenaette H
Bought by
Groover Lonnie Estat
Purchase Details
Closed on
Nov 3, 1989
Bought by
Groover Jenaette H
Create a Home Valuation Report for This Property
The Home Valuation Report is an in-depth analysis detailing your home's value as well as a comparison with similar homes in the area
Home Values in the Area
Average Home Value in this Area
Purchase History
| Date | Buyer | Sale Price | Title Company |
|---|---|---|---|
| Cornerstone Real Estate Llc | $29,500 | -- | |
| Boykin Lita O | -- | -- | |
| Sec Of Housing & Urban | $61,593 | -- | |
| Bank Of America | -- | -- | |
| Bank Of America | -- | -- | |
| Cox Kimberly | -- | -- | |
| Appraisal | $68,200 | -- | |
| Cox Freddie D | $56,000 | -- | |
| Groover Joseph | $35,000 | -- | |
| Groover Lonnie Estat | -- | -- | |
| Groover Jenaette H | -- | -- |
Source: Public Records
Tax History Compared to Growth
Tax History
| Year | Tax Paid | Tax Assessment Tax Assessment Total Assessment is a certain percentage of the fair market value that is determined by local assessors to be the total taxable value of land and additions on the property. | Land | Improvement |
|---|---|---|---|---|
| 2024 | $1,479 | $54,143 | $7,410 | $46,733 |
| 2023 | $1,393 | $47,820 | $3,380 | $44,440 |
| 2022 | $1,396 | $48,354 | $3,380 | $44,974 |
| 2021 | $1,131 | $36,044 | $3,380 | $32,664 |
| 2020 | $1,041 | $32,831 | $3,380 | $29,451 |
| 2019 | $1,027 | $31,760 | $3,380 | $28,380 |
| 2018 | $1,107 | $33,926 | $3,360 | $30,566 |
| 2017 | $1,106 | $33,926 | $3,360 | $30,566 |
| 2016 | $1,106 | $33,926 | $3,360 | $30,566 |
| 2015 | $1,117 | $33,925 | $3,360 | $30,566 |
| 2014 | $1,115 | $33,925 | $3,360 | $30,566 |
| 2013 | -- | $33,925 | $3,359 | $30,565 |
Source: Public Records
Map
Nearby Homes
- 235 Cherokee Ave
- 229 Cherokee Ave
- 234 Cherokee Ave
- 237 Cherokee Ave
- 218 Cherokee Ave
- 289 Cherokee Ave
- 243 Cherokee Ave
- 239 Cherokee Ave
- 2510 Abc Ave
- 0 Cherokee Ave
- 0 Abc Ave
- 2514 Abc Ave
- 124 Union St
- 204 E Wacona Dr
- 106 Briarwood Rd
- 126 Union St
- 1 Casey Ln
- 210 E Wacona Dr
- 2747 State St
- 102 Briarwood Rd